Viewing the Kubeflow Dashboard
To view the run for a Kubeflow pipeline, click on the Kubeflow icon on the toolbar of the project Home Page (see below, refer here to learn how to get to the project Home Page)

The Kubeflow dashboard opens (below)
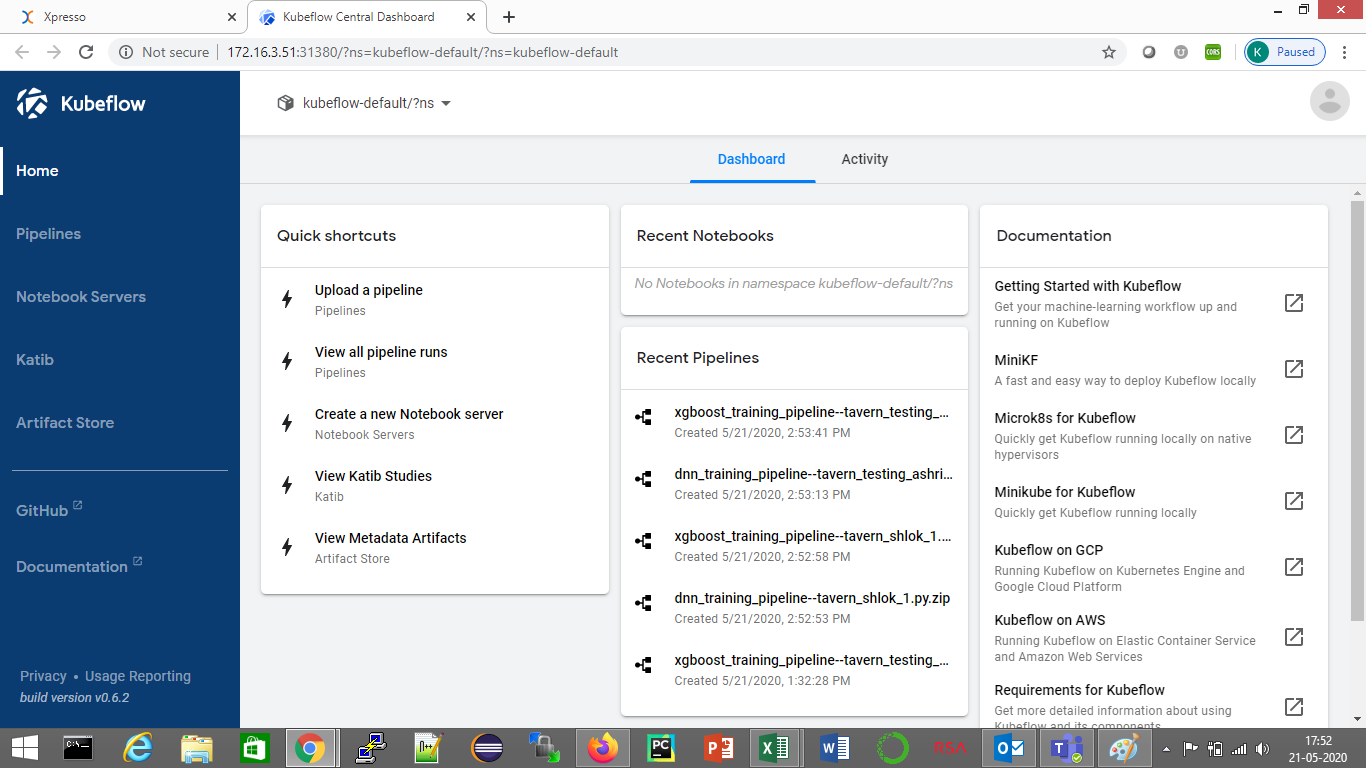
The Kubeflow dashboard is useful at two points in the develop life cycle
1. Viewing deployed pipelines
If you have just deployed a (non Big Data) pipeline, you can use the Kubeflow dashboard to confirm that it was deployed correctly.
Click the “Pipelines” link on the left panel. This opens the Pipelines page (below)
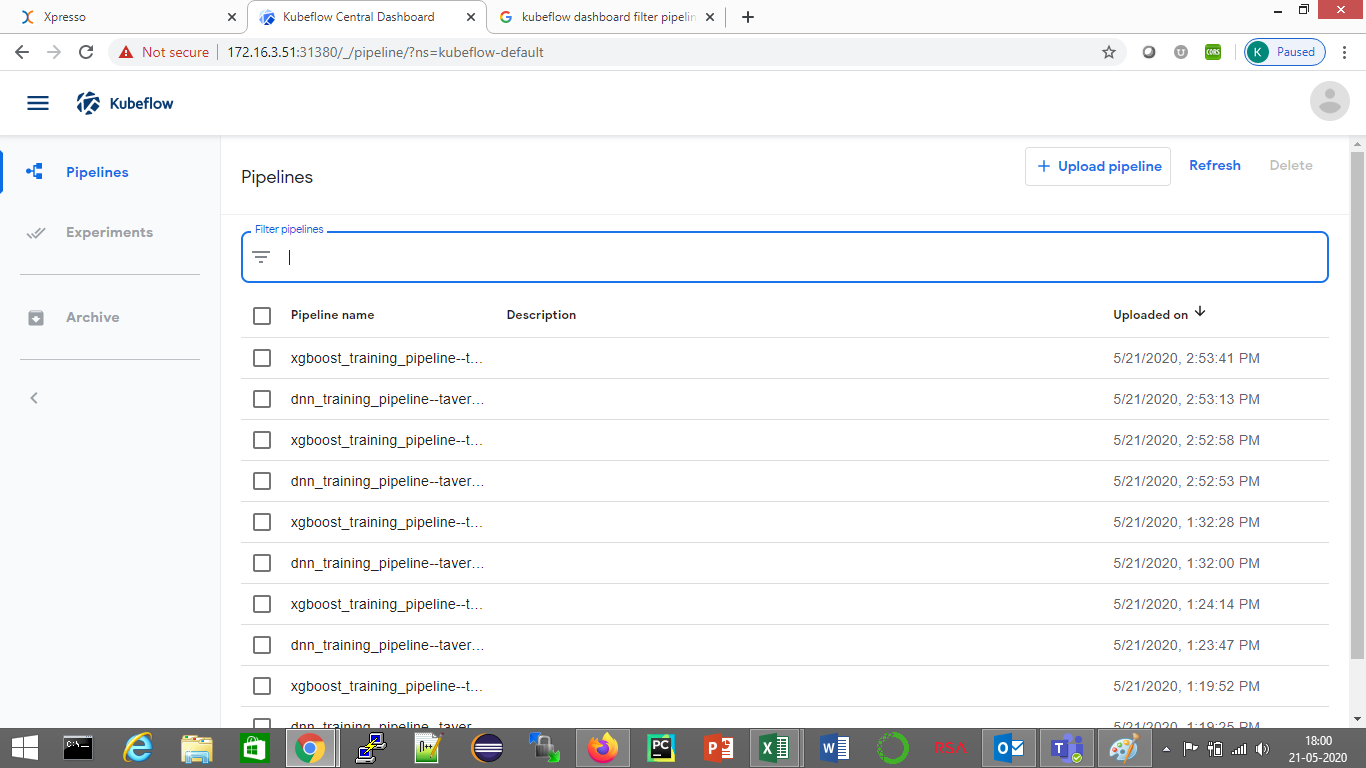
Tip: the filter pipeline functionality may not work correctly. Pipelines are sorted reverse chronologically by default. You can sort them by name to make your search easier. Pipelines are named as <pipeline_name>–<project_name>_<pipeline_version>
Find your pipeline from the list and click it to see details (below).
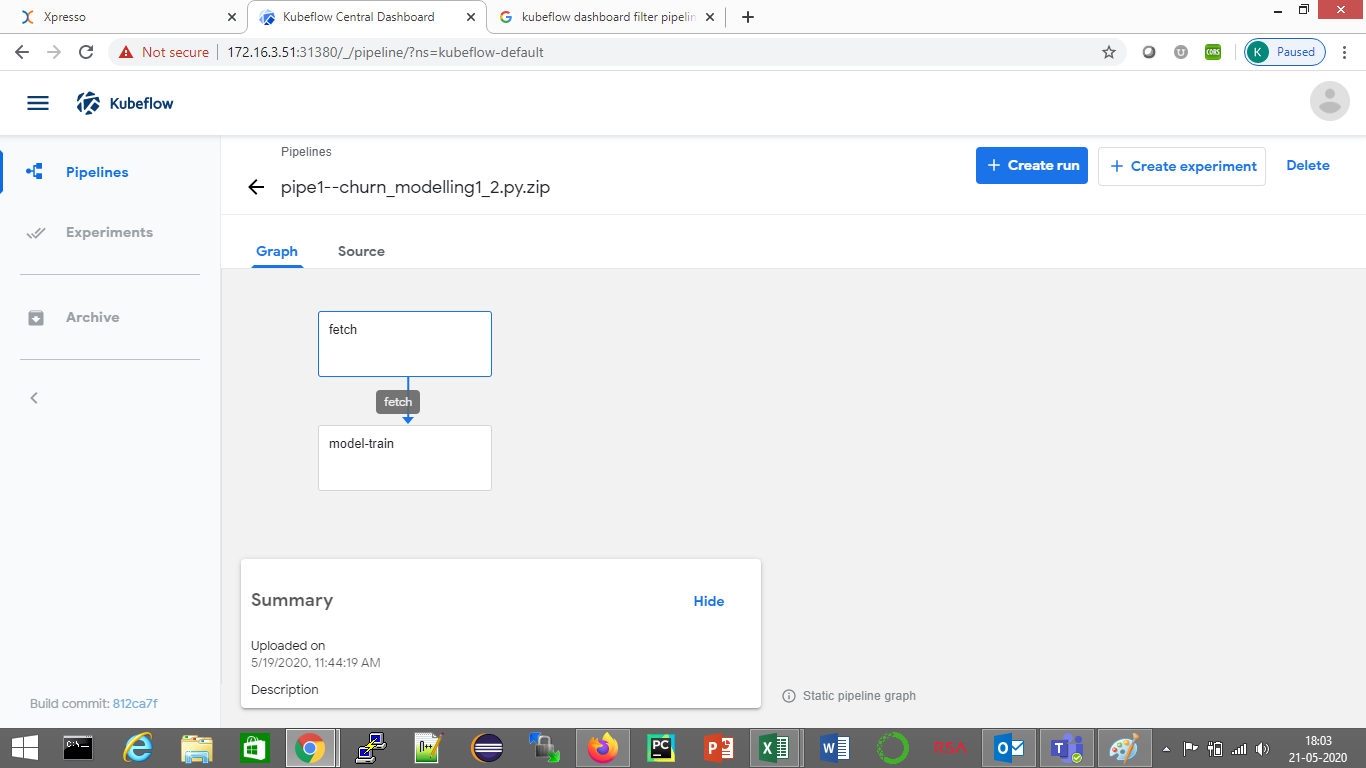
This shows the execution graph of the pipeline. You can examine this graph to ensure tat all the components were deployed correctly, and the execution sequence is correct
2. Viewing experiment runs
You can view an experiment run using the Kubeflow dashboard. To do this, click the “Experiments” link on te left panel. The experiment names are displayed.
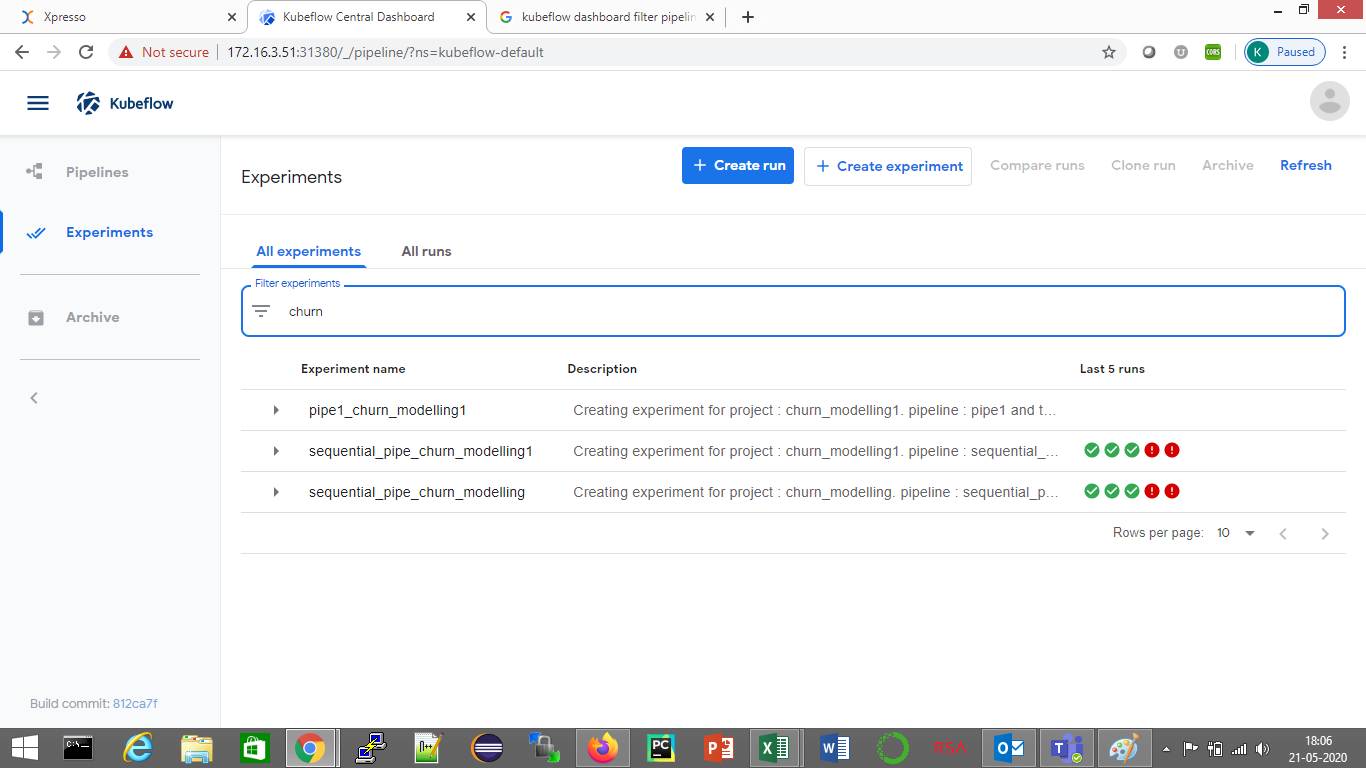
On this screen, you can see the pipeline name (without the version number), description and a quick summary of results of the last 5 runs
Tip: on this screen, you can find your pipeline by using the name filter on this screen.
Click the arrow on the left of your pipeline to see all the experiments run on the pipeline (below)
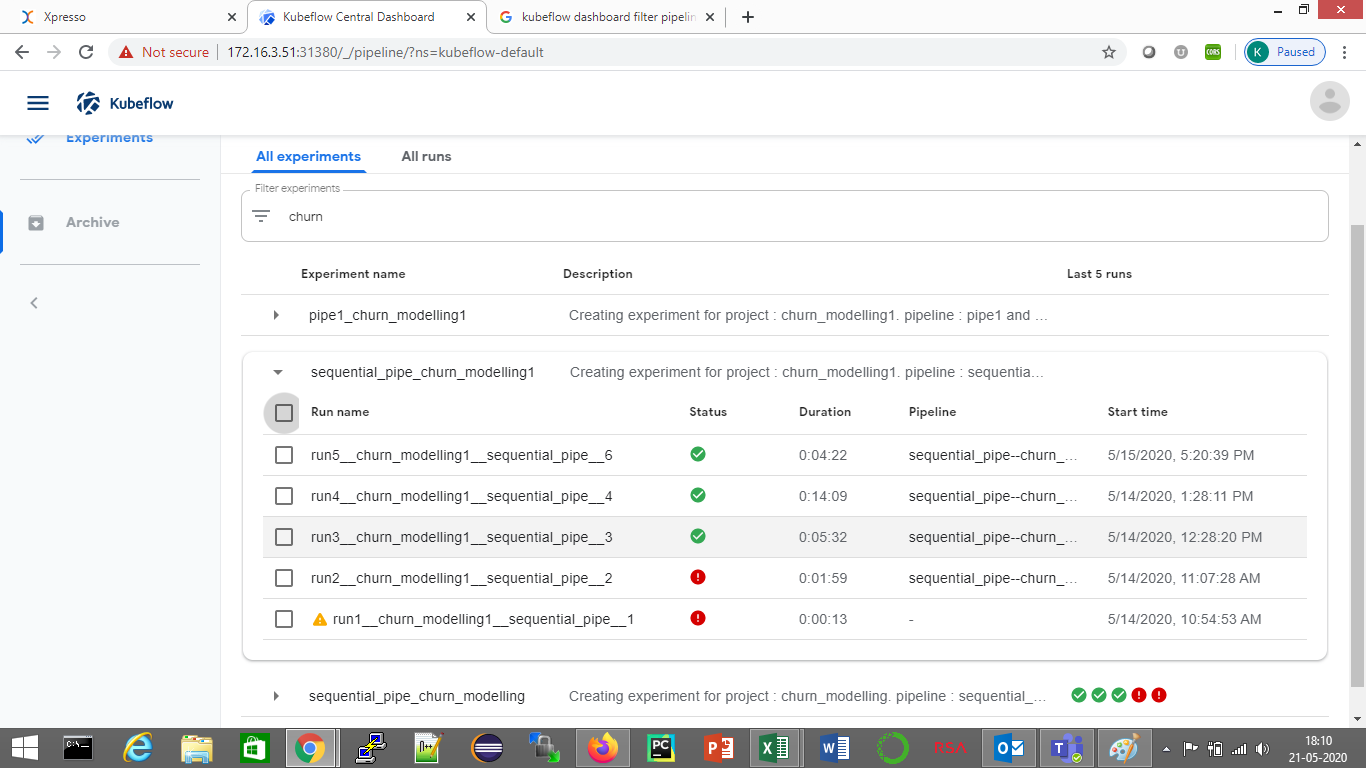
Experiment runs are named <run name>__<project_name>__<pipeline_name>__<pipeline_version>
Click on an experiment name to see its execution results (below)
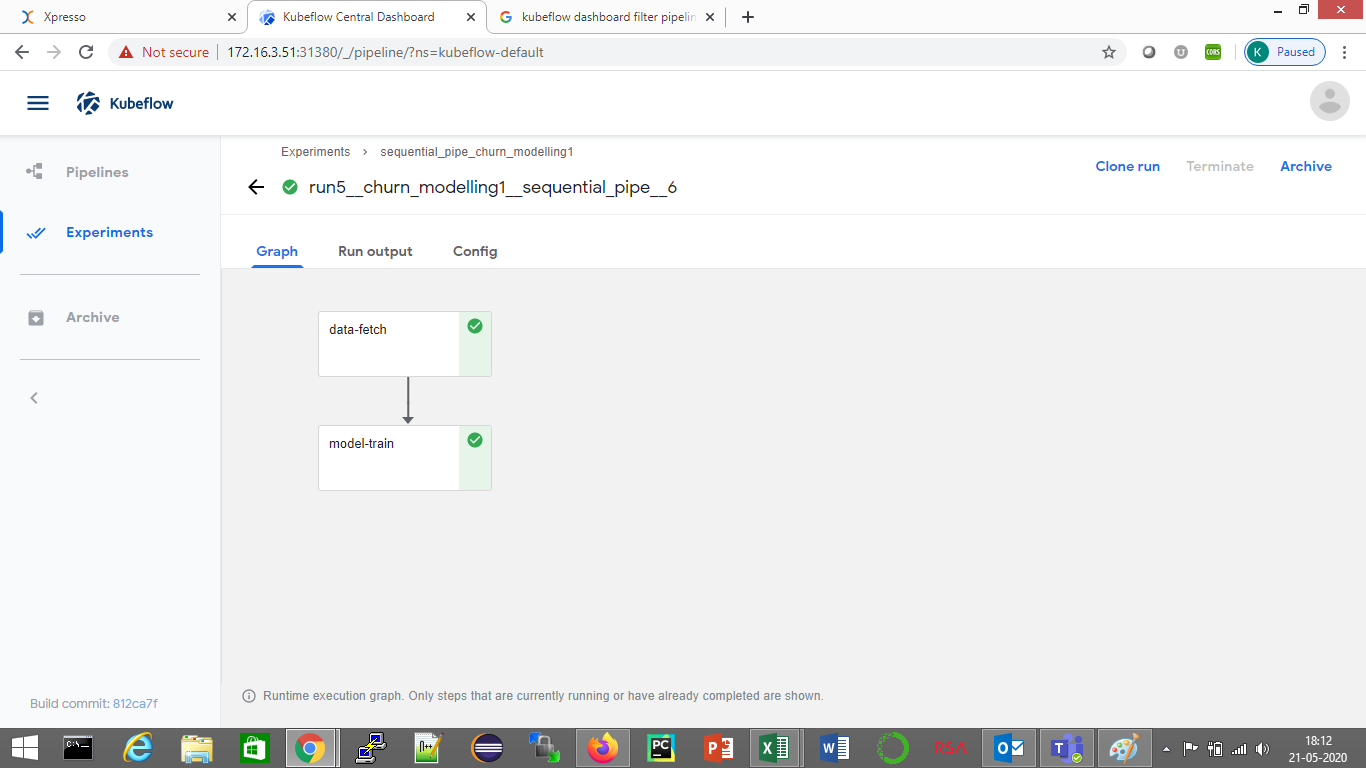
The Kubeflow dashboard only shows pipeline components that have either completed execution, or are currently being executed. Components that have not yet started execution are not displayed
Click on a component to see the actions you can perform on it (below)
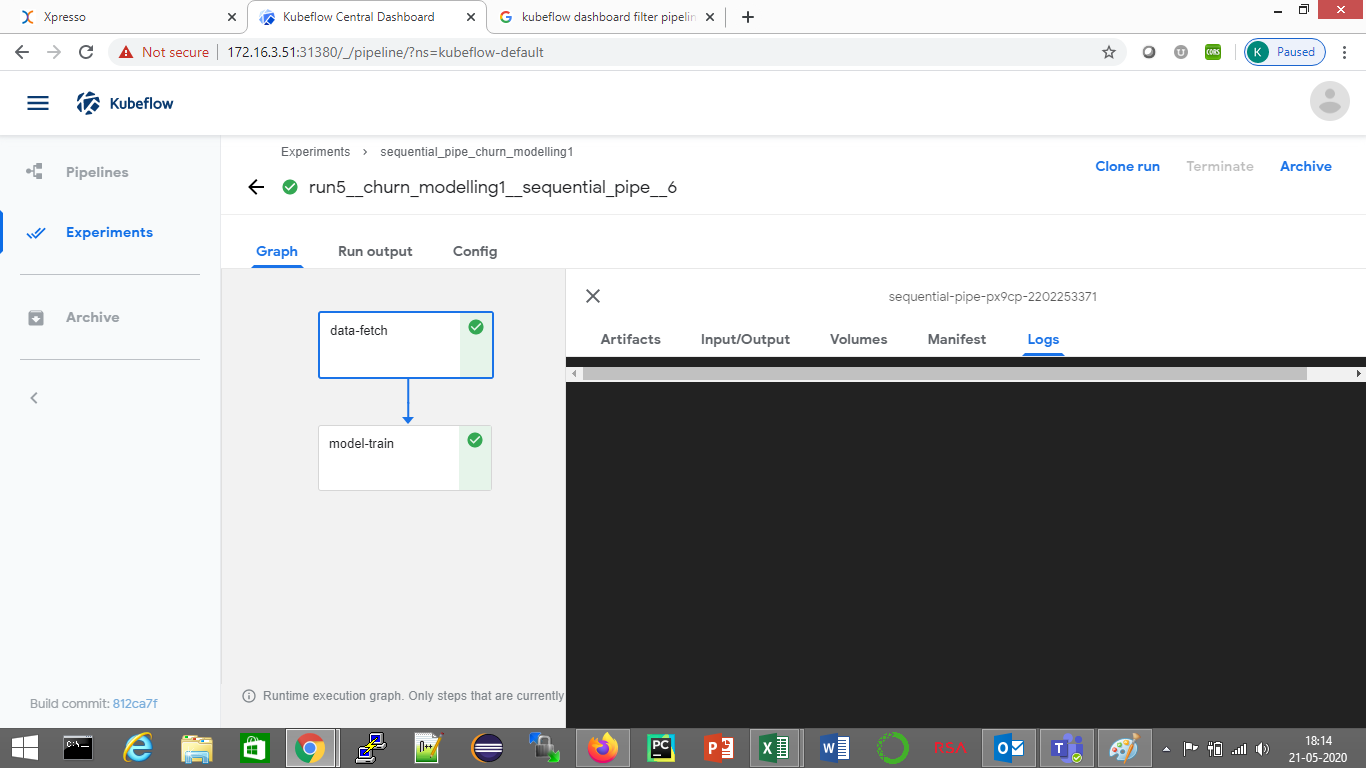
The most commonly used actions are:
Input / Output - you can verify the input / output parameters passed to the pipeline
Logs - you can view component logs