DevOps
Deployment is the process by which the binaries created by the build process are sent over to target environments for (immediate or later) execution. You can deploy non-Big Data components and pipelines, inference services, Big Data components and pipelines.
After you have created the code for a component, you need to build it. This will create a Docker image of the component, enabling you to deploy it to the target environment. You can view the build status of all solution components/pipelines in a table.
Tip
Among pipelines, only distributed (Spark) pipelines can be built. Non-distributed (Kubeflow) pipelines cannot be built, as they have no code associated with them.
This section contains information on how you can work with new builds and deployments and view details related to them.
For more information on these topics, see the following:
Viewing Builds
You can create a new build, view the build history and build details of a solution component, and perform additional tasks on this page.
After you log in to the xpresso.ai Control Center, click on any ‘active solution’. On the page that appears, from the left-hand menu, click Dev Ops and then click Builds. A dashboard appears.

You can view the following details on this page:
Last Build Completed On - shows the date and time when the component pipeline was last built
Last Built - name of component/pipeline
Last Build ID - ID of developer who built the component / pipeline
Last Build Time Taken
Last Build Status - status of last build (Success/In Progress/Failure)
Last Build Time Taken (in seconds)
Build Description
Build Type
This page provides two options to view details – the “Chart” view and the “Table” view.
Changing View
You can view the details of Builds using either the “Chart View” or a “Table View”. To change the view, on the right corner, click “Chart View” or “Table View”.

You can also view results from a specific page, search for specific builds, and export your data to an Excel file.
To search for a specific build, use the search box to search for a component using any field (see below for an example using a build date for the search)

To choose the number of builds that you can view on a single page, click the arrow and choose from 5, 10, 15 or 20 entries.

To export your data into an Excel file, click Excel Export.

You can skip to a specific page or move to the first or last page of entries by clicking the page number or the arrows, respectively.

You can drag any column header to the top of the table to group by the column (see below for an example of data grouped by “Last Build By”)

You can click any column name to sort by the column and click again for reverse sort (see below for an example of the list reverse-sorted by date).

You can also filter some of the columns such as “Name”, “Type”, “Latest Build Status” and Last Build By” that support filtering. Click the filter icon next to these columns to filter by the value(s) specified (see below for an example of filtering by Name)

Viewing the build history of a solution component
To view the build history of a component, on the “All Builds” page, click the component name under the column “Name”.
The Build History page containing the build history of the selected component/pipeline table appears.
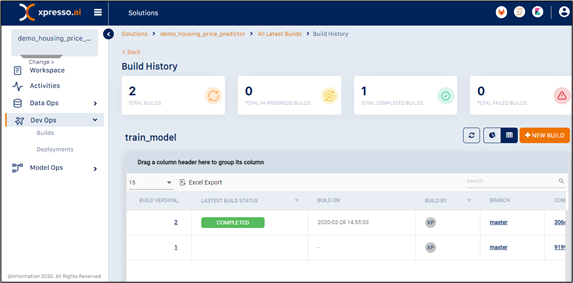
You can view the following details on this page:
Build Version - shows the build version
Latest Build Status - status of the build (Completed/Running/Failure)
Build On - shows the date and time when the component/pipeline was built
Build By - ID of developer who built the component/pipeline
Branch - code repository branch from which the component code was taken for the build
Commit ID - commit ID of code used for the build
Description - build description
You can perform the following actions on the table:
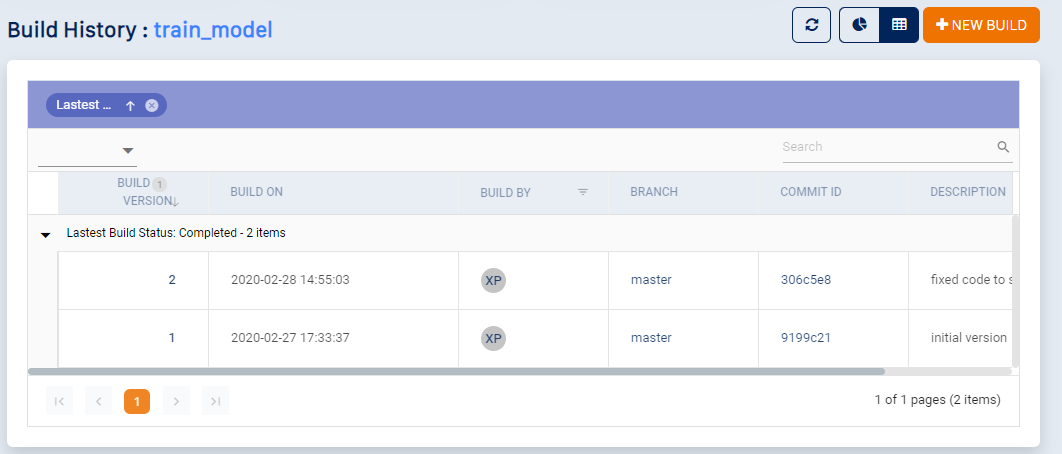
You can drag any column header to the top of the table to group by he column (see below for an example of data grouped by “Build Status”)
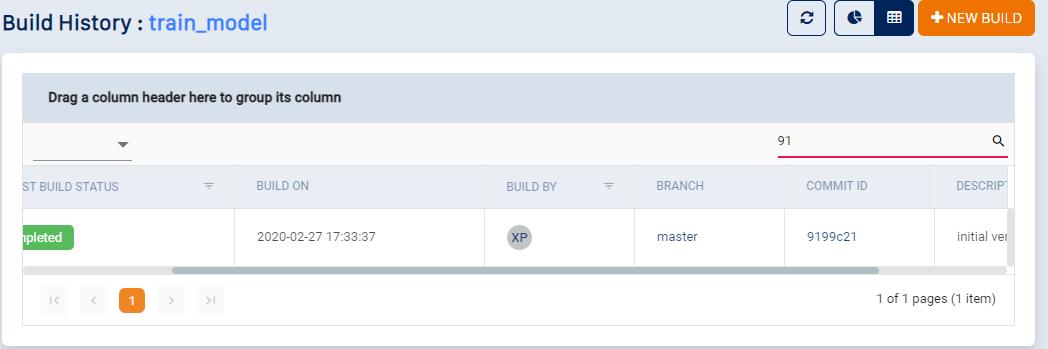
You can use the search box to search for a component using any field (see below for an example using a partial commit ID for the search).
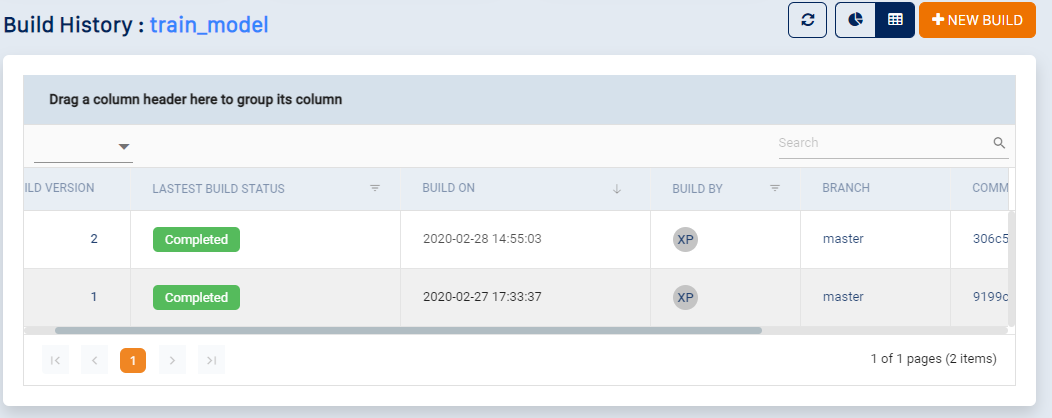
You can click any column name to sort by the column. Click again for reverse sort (see below for an example of the list reverse-sorted by date).
You can filter some of the columns such as “Build By” and “Build Status” that supports filtering. Click the filter icon next to these columns to filter by the value(s) specified (see below for an example of filtering by “Build By”)
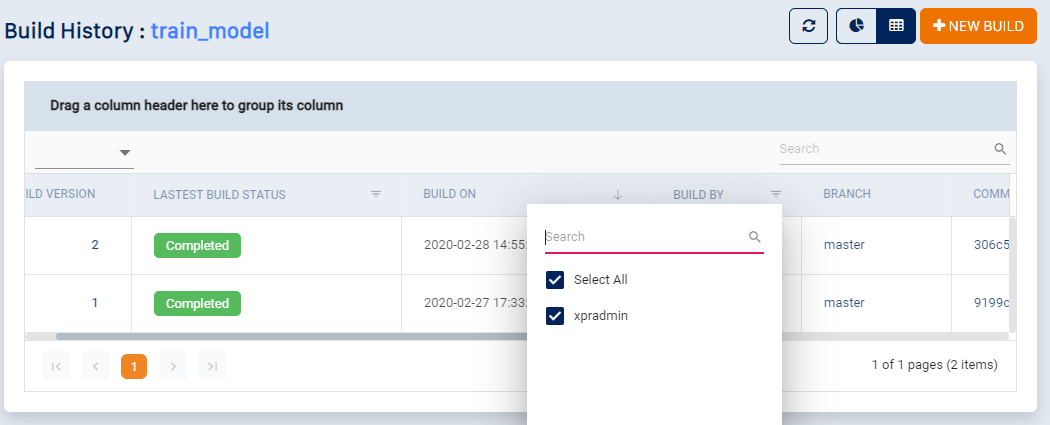
You can view the branch details in the code repository by clicking the branch name.
You can view the commit details in the code repository by clicking on the commit ID.
Creating a new build
To create a new build pipeline, on the top right, click New Build. The “New Build” page appears.
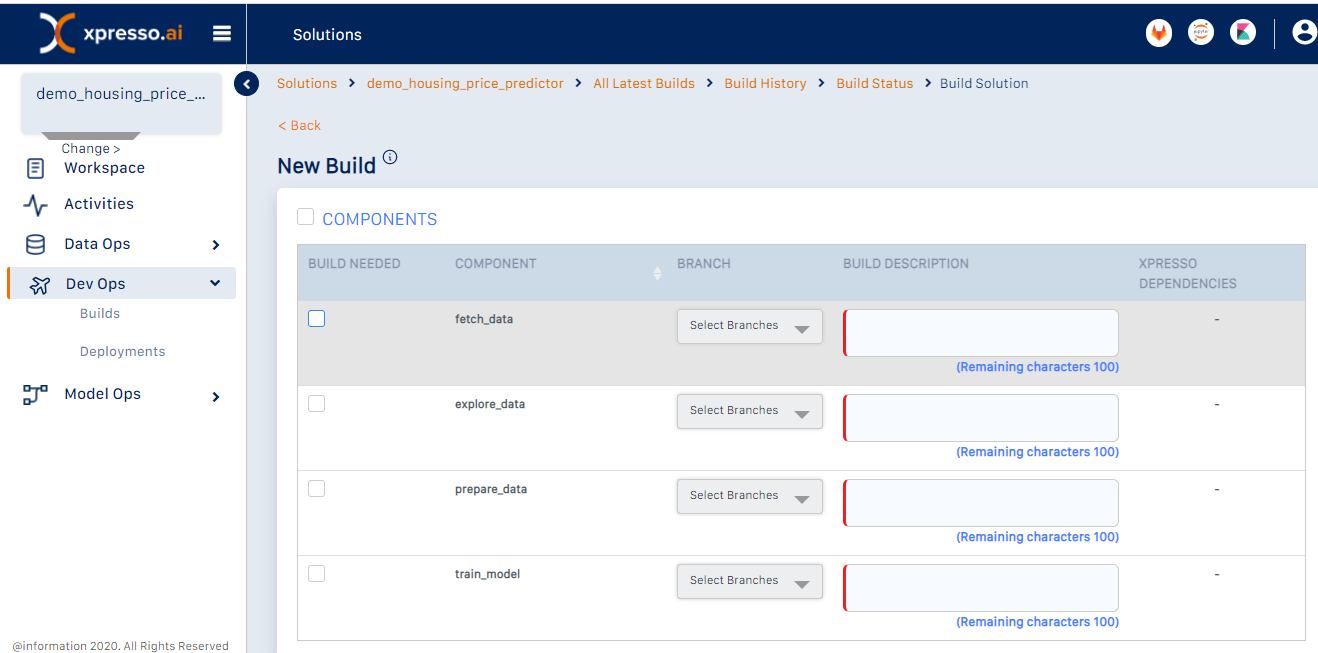
The components and pipelines eligible for a build are listed on this page.
Tip
Service meshes and Kubeflow pipelines need not be built, as these are just containers for components.
Select the “Build Needed” checkbox for the components you need to build.
Tip
You can select multiple components for a build.
From the “Branch” drop-down, select the branch from which to pull the component code.
Enter a description (within 100 words) for the build.
Click Build to start the build. The build request is submitted to the build pipeline and a message similar to the following appears:
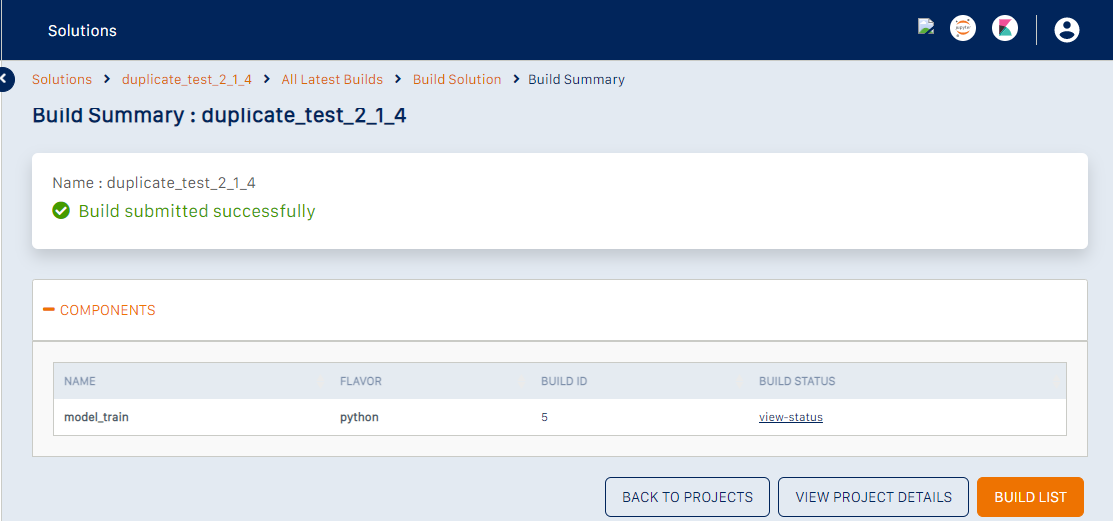
Expand the “Components” section to see details of each component.
Click the “view-status” link to see the build status of each component.
Viewing the build details of a solution component
To view the details of a specific build version of a component, on the “Build History” page of the component, click the build version ID.
The “Build Status” page appears.
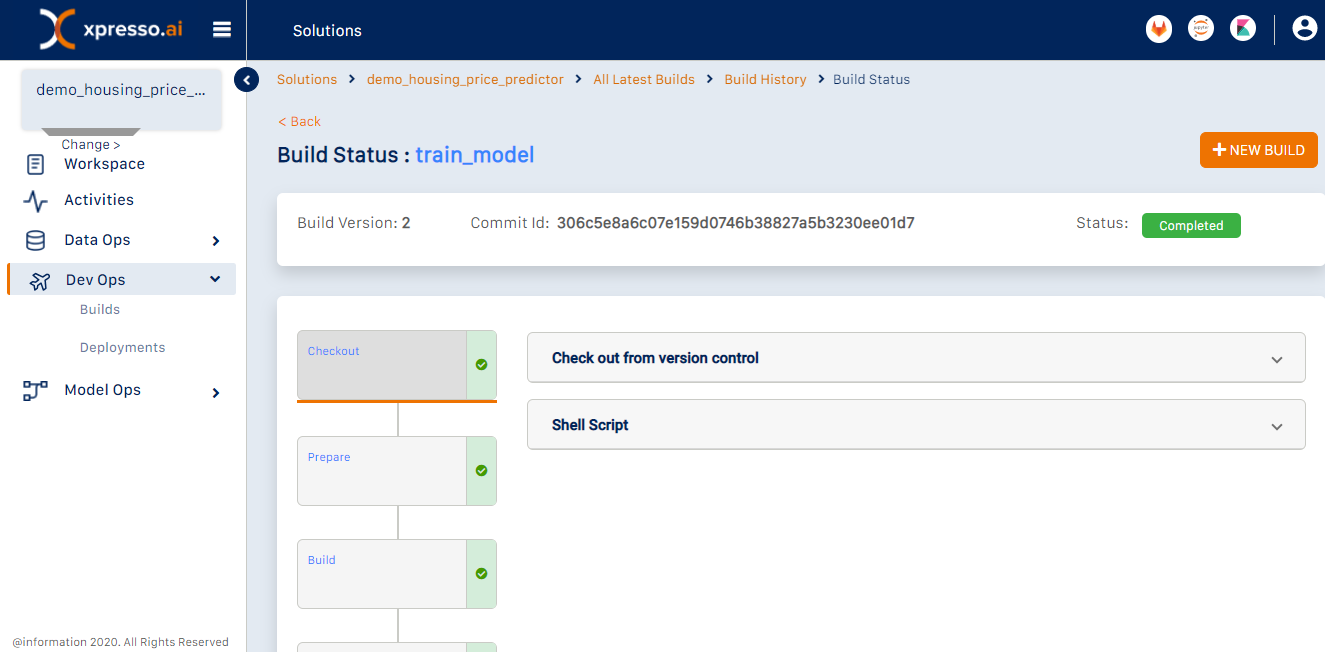
This page displays the various stages of the build pipeline for the component. The stages are displayed as a pipeline on the left side of the page, with the completed stages checked.
Click any stage to view the logs on the right. For example, see below the screenshot
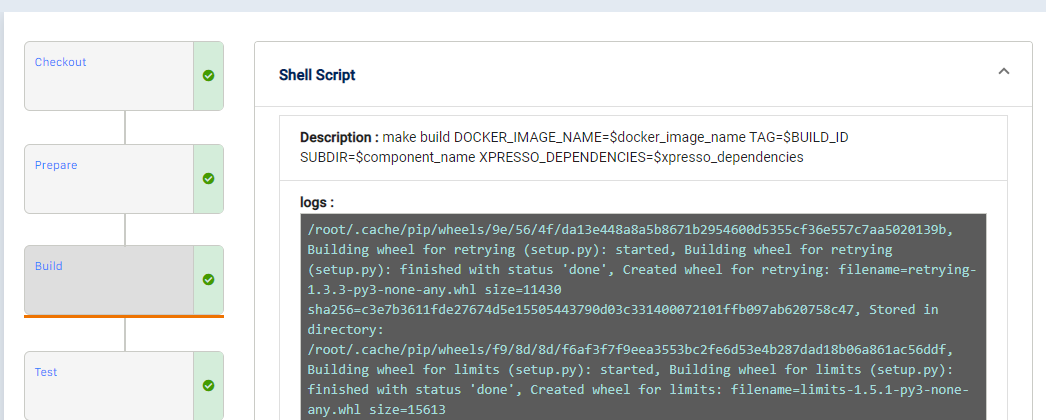
The build logs enable you to debug the build pipeline for the component.
Viewing Deployments
You can create a new deployment, view the latest deployment status of a solution, deployment history of a component, deployment details of a solution component or pipeline, and perform additional tasks on this page.
After you log in to the xpresso.ai Control Center, click on any ‘active solution’. On the page that appears, from the left-hand menu, click Dev Ops and then click Deployments. A dashboard appears.
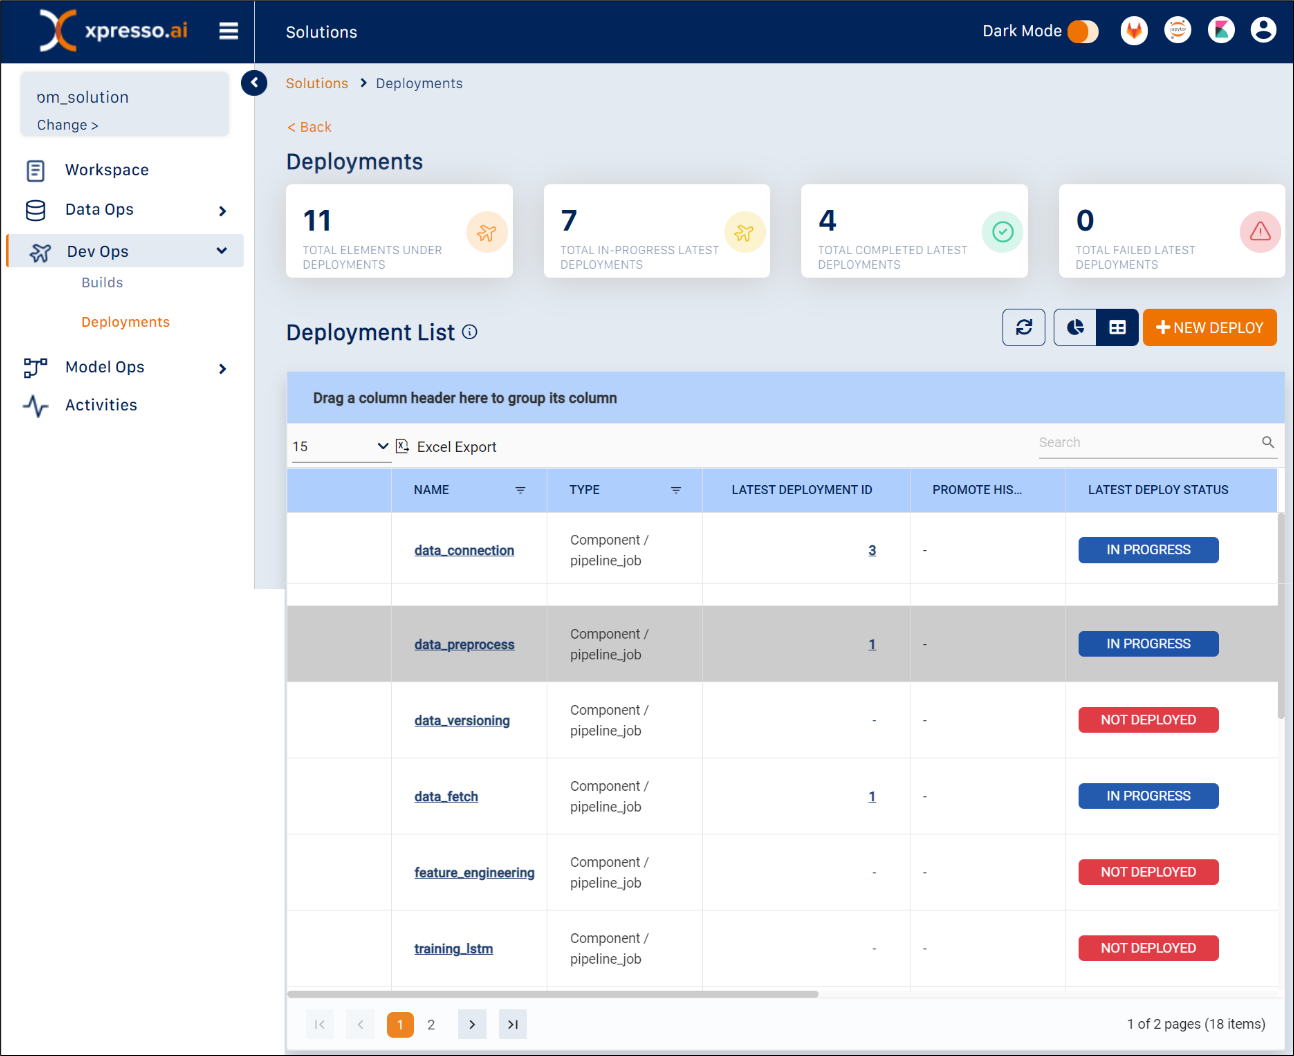
The “All Deployments” page appears. This page displays the deployment status of all solution components/pipelines in a table.
You can view the following details on this page.
Name - name of component / pipeline
Type - component or pipeline
Latest Deployment ID - shows the latest deployed version of the component/pipeline
Latest Deploy Status - shows the status of the last deployment
Latest Deploy On - shows the date and time when the component/pipeline was last deployed
Latest Deploy By - ID of developer who deployed the component/pipeline last
Flavor - indicates the language in which the component was written
Total Deployments - number of times the component/pipeline has been deployed
Changing View
You can view the details of Deployments using either the “Chart View” or a “Table View”. To change the view, on the right corner, click “Chart View” or “Table View”.

You can also view results from a specific page, search for specific deployments, and export your data to an Excel file.
To search for a specific deployment, use the search box to search for a component using any field (see below for an example using a deployment date for the search)
To choose the number of deployments that you can view on a single page, click the arrow and choose from 5, 10, 15 or 20 entries.

To export your data into an Excel file, click Excel Export.

You can skip to a specific page or move to the first or last page of entries by clicking the page number or the arrows, respectively.

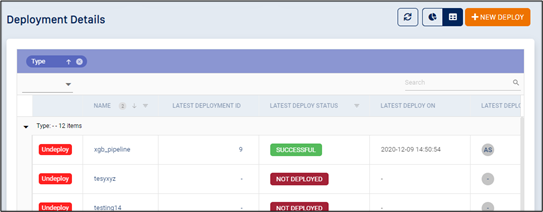
You can group by the column by dragging the column header for the “Type” column to the top of the table to (see below for an example of data grouped by “Type”)
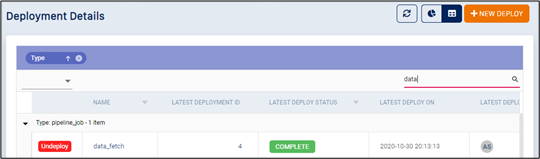
You can use the search box to search for a component using any field (see below for an example using “data” as the search string)
You can sort by the column by clicking any column name. Click again for reverse sort (see below for an example of the list reverse-sorted by name)
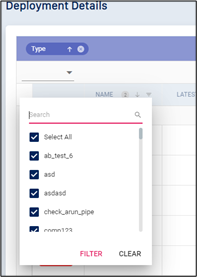
You can filter some of the columns (“Name”, “Type”) that support filtering. Click the filter icon next to these columns to filter by the value(s) specified (see below for an example of filtering by Name).
Viewing the deployment history of a solution component
To view the deployment history of a component, on the “All Deployments” page, click the component name.
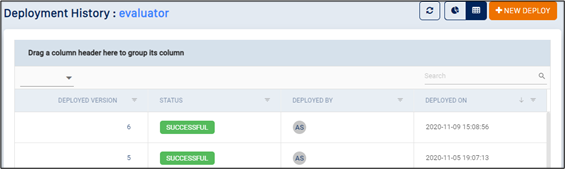
The Deployment History page for the component appears. This page displays the deployment history of the selected component/pipeline in a table.
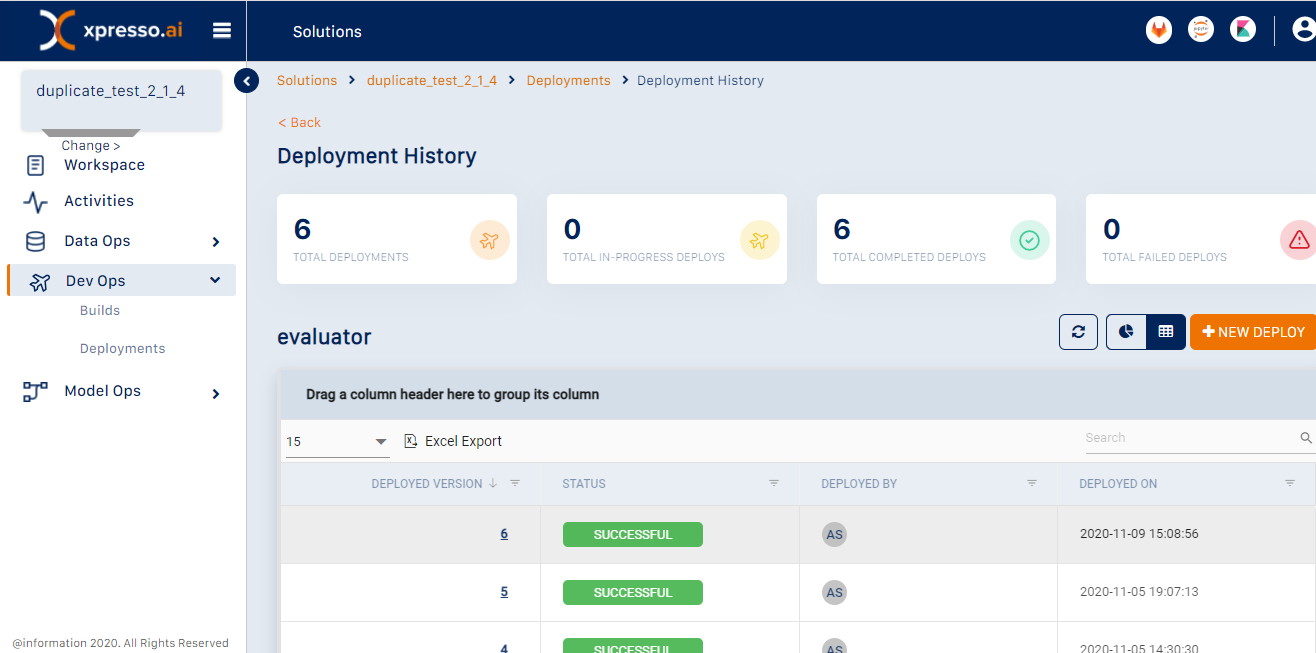
You can view the following details on this page.
Deployed Version - shows the deploy version
Status - status of the deployment (Successful/ In Progress/Failure)
Deployed By - ID of developer who deployed the component/pipeline
Deployed On - shows the date and time when the component/pipeline was deployed
Changing View
You can view the details of Deployments using either the “Chart View” or a “Table View”. To change the view, on the right corner, click “Chart View” or “Table View”.

You can also view results from a specific page, search for specific deployments, and export your data to an Excel file.
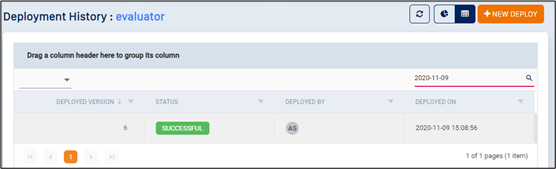
To search for a specific deployment, use the search box to search for a component using any field (see below for an example using a deployment date for the search)
To choose the number of deployments that you can view on a single page, click the arrow and choose from 5, 10, 15 or 20 entries.
To export your data into an Excel file, click Excel Export.
You can skip to a specific page or move to the first or last page of entries by clicking the page number or the arrows, respectively.
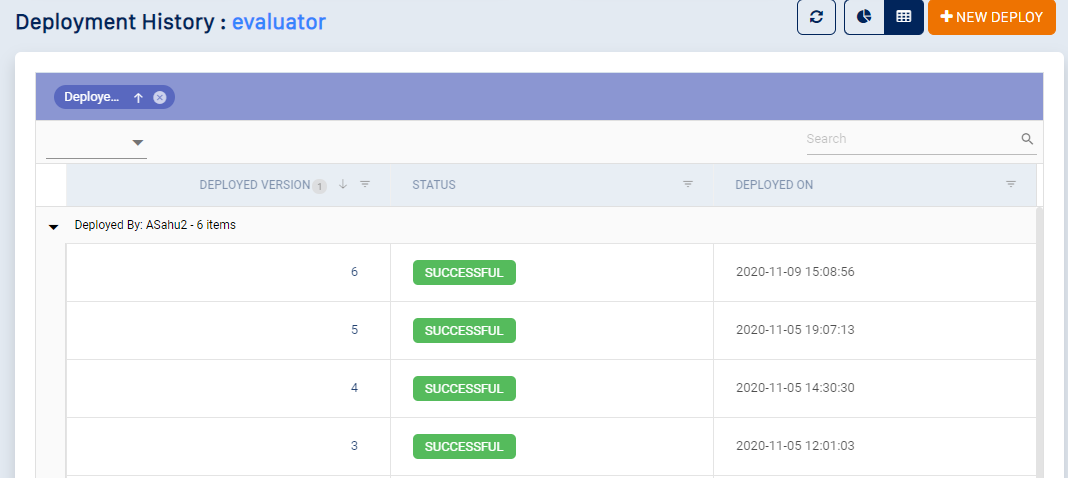
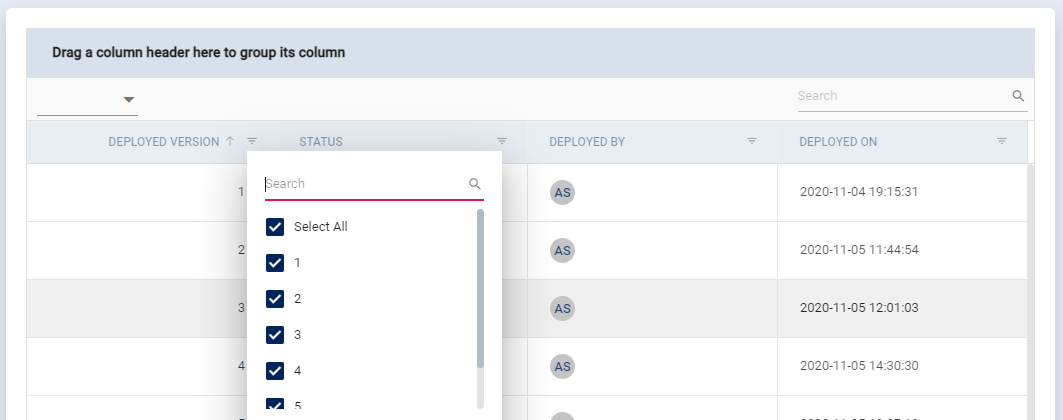
You can group by the column by dragging the column header for the “Type” column to the top of the table to (see below for an example of data grouped by “Deployed By”)
You can click on any column name to sort by the column. Click again for reverse sort (see below for an example of the list reverse-sorted by deployment date)
You can filter all the columns that support filtering. Click the filter icon next to these columns to filter by the value(s) specified (see below for an example of filtering by “Deployed Version”)
Viewing the deployment details of a solution component or pipeline
To view the details of a specific deployed version of a component or pipeline, click the deployment version ID on the “Deployment History” page of the component.
The “Deployment Status” page appears.
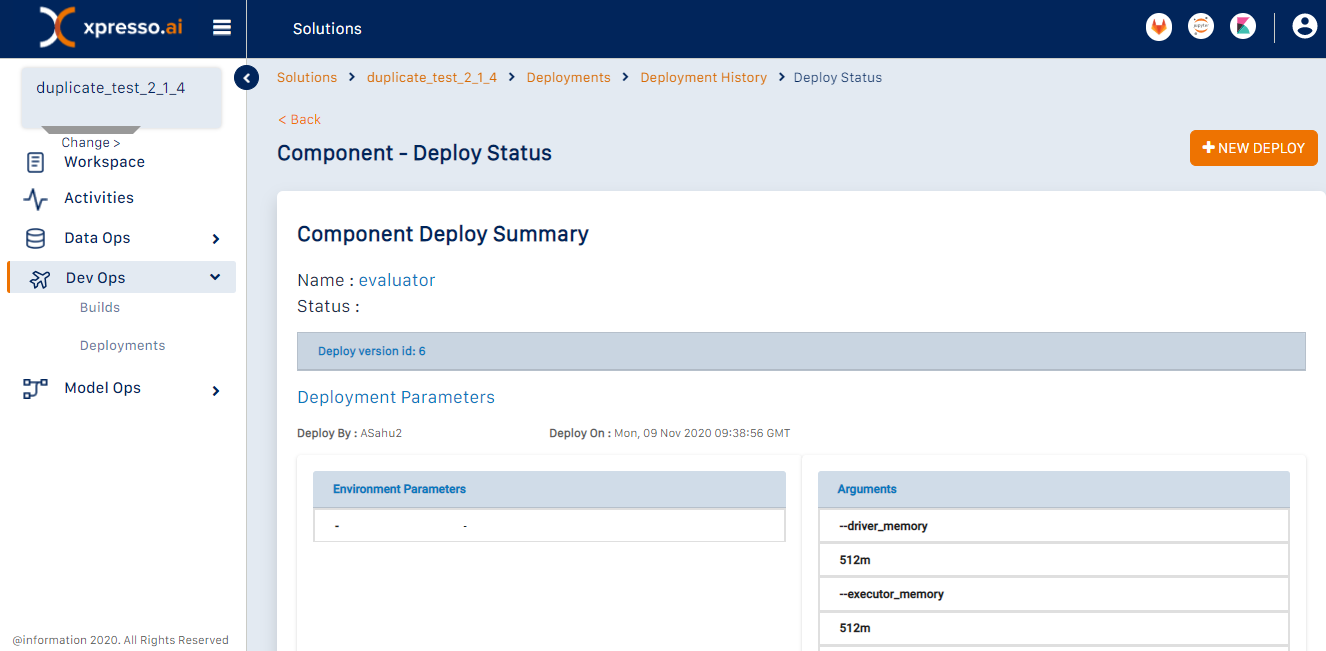
For a component, this page has three sections that provides you details of a deployment.
Deployment Parameters - this section details the parameters provided at the time of deployment (environment parameters, command line arguments, ports, etc.)
Kubernetes Parameters - this section describes the details provided to the Kubernetes cluster for deployment
Pod Details - this section details the Kubernetes pods used for the deployment
For a pipeline, the deployment status page is as shown below:
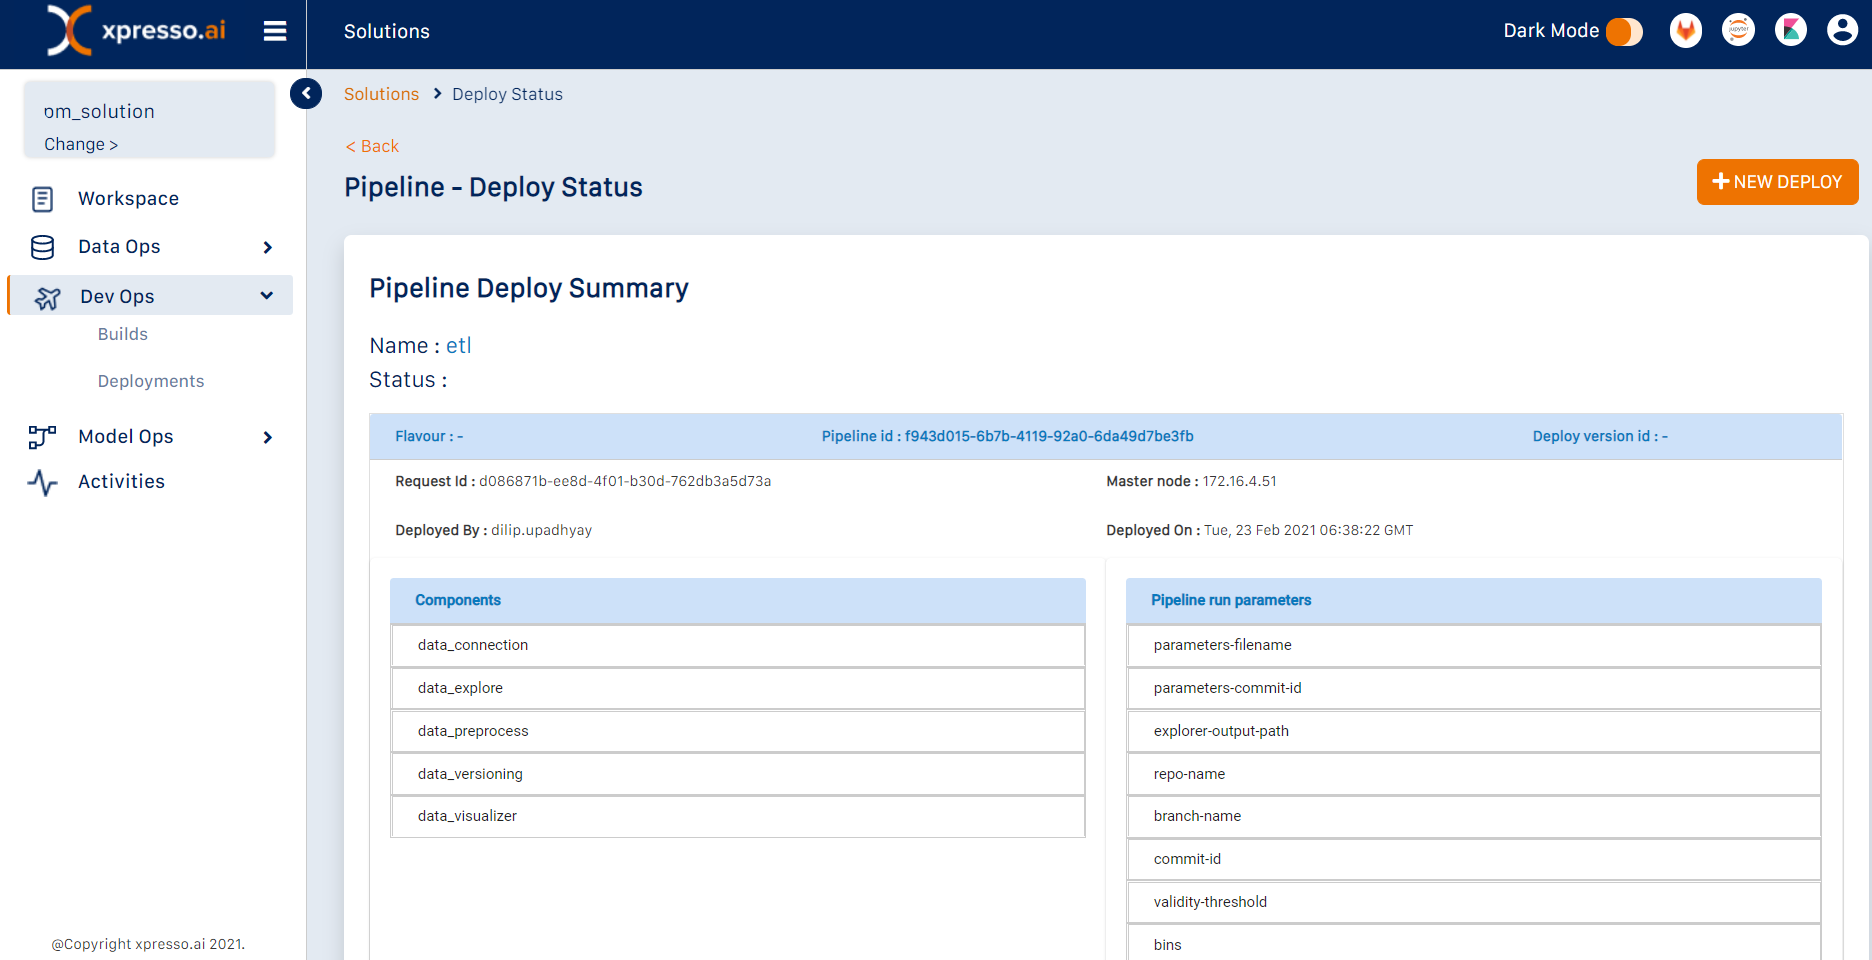
This has two sections describing the deployment:
Pipeline Parameters - details the parameters used when running the pipeline
Component details - details the parameters used for each individual component when deploying the pipeline
Starting a new deployment
To start a new deployment, on the “Deployment page” page (or any of its sub-pages), click New Deploy.
The “New Deployment” page appears.
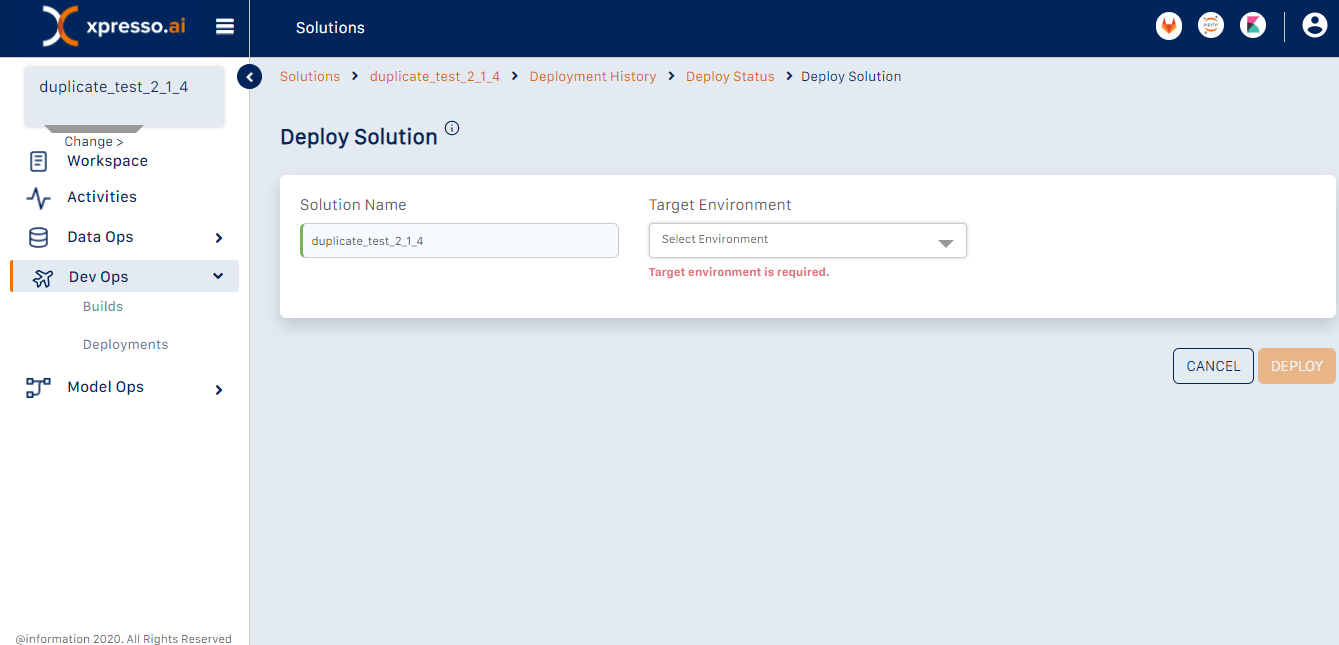
On this page, from the “Target Environment” drop-down, select the target environment you wish to deploy to.
Tip
The drop-down will display two options “Distributed” and “Non-Distributed”. You can choose “Distributed” if you have a Spark component or pipeline to be deployed. Else, select “Non-Distributed”.
Starting a new component deployment
Expand the “Components” section of the page and select the component(s) you wish to deploy.
Tip
If you intend your components to be used as part of a pipeline, there is no need to deploy them individually. You can just specify their deployment details when you deploy the pipeline.
The red cross against each selected component indicates that the deployment parameters for the component have not been configured.
The mandatory parameters can be filled on the same page. When the mandatory component deployment settings have been specified, a green check mark appears against the component. This indicates that its deployment parameters have been set.
To specify optional deployment parameters, click the “Advanced Settings” icon.
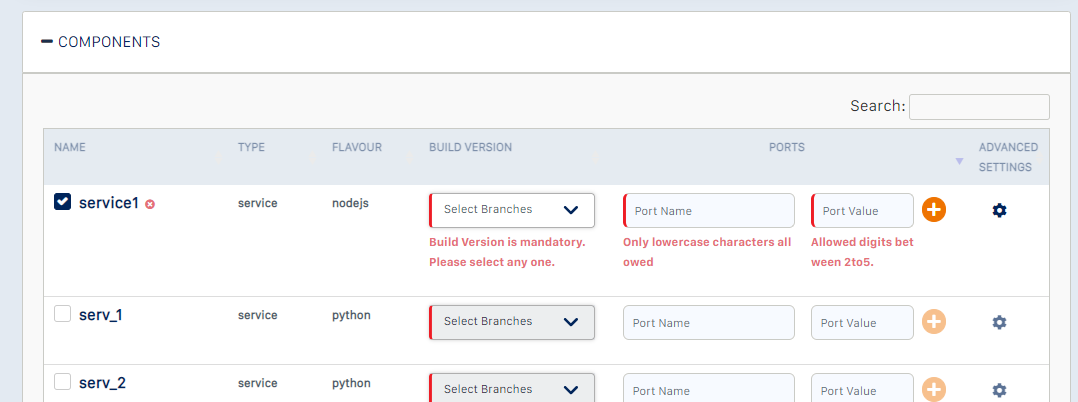
You can specify the following mandatory details on this page:
Build Version - the build version of the component that you want to deploy.
Port name and value
Tip
The Build version will usually be the latest version. If the component you wish to deploy is from the xpresso.ai Component Library, you can specify the Custom Docker Image instead, using the “Advanced Settings” dialog.
If the component is of the type “service”, you must specify the names and values (i.e., port numbers) for the ports that your service will expose internally so that they may be used by other components.
At least one port (usually named “default”) is mandatory.
The port name should be specified in lower case characters.
The port value should be an integer, between 2 and 5 digits long. This must be the same as the port number specified in the code when running the service within Flask.
For Additional settings, you can specify the following:
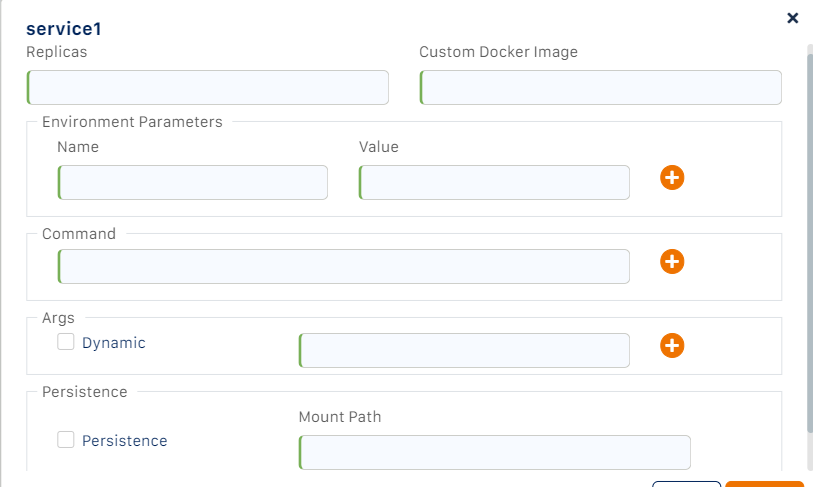
Replicas - the number of copies of the component that you want to deploy.
Tip
This is useful for service components when you expect a large number of requests on the component.
xpresso.ai will automatically create a load balancer, which will distribute the incoming requests among the service replicas.
This must be an integer greater than zero.
Custom Docker Image – allows you to specify the Docker Image URL instead of the Build Version if you are deploying a pre-built component (e.g., from the xpresso.ai Component Library).
Tip
If you specify both the Build version and the Custom Docker image for the component, the Custom Docker image will be used.
c. Environment Parameters - the environment parameters passed to the component, as name-value pairs. Use the “+” icon to add more environment parameters, and the “-” icon to remove any.
d. Command - commands that you want the Docker image of the component to run. Use the “+” icon to add more commands, and “-” icon to remove any.
e. Args - argument values to the commands executed within the Docker image of the component.
Tip
If you want to specify the argument name and specify the argument value at run-time, check the “Dynamic” checkbox and enter the argument name.
The dynamic argument option is applicable only when a component is included in a pipeline. When a component is deployed on its own, it is run immediately. The argument values passed to it as part of the command - dynamic arguments are not supported
f. Persistence - each component has access to the shared file system from which it can access any required file. To use this drive, check the “Persistence” checkbox, and specify the mount path. This will be used by your component to access the files.
Tip
For example, if you specify the mount path as “/data”, this will be the root folder for the mount, and hence, your component should use “/data” as the prefix for accessing any files on the NFS drive.
i. Job Sub-Type - components of type “job” or “pipeline_job” can optionally be deployed as Cron (scheduled) jobs.
Tip
If you want your job to be scheduled, specify the “Type” as “cronjob”, and then specify the “Cron Schedule” using Cron format (see this link for details).
If you do not want to schedule the job, specify the “Type” as “job” instead of “cronjob”
Click “Update” on the “Advanced Settings” dialog to save the optional parameters, and return to the “New Deployment” page
Repeat this configuration step for each of the components selected for deployment.
To deploy the selected components, click Deploy. If the deployment is successful, a status message appears.
Tip
You can deploy multiple components and pipelines together. To do this, select and configure them for deployment. However, you cannot deploy to multiple environments simultaneously.
To see the result for each component, expand the components section.
To view the status of the deployment, click the “view-status” link.
Starting a new pipeline deployment
Expand the “Components” section of the page and select the component(s) you wish to deploy.

Select individual builds of each component.

For Additional settings, you can specify the following:

Custom Docker Image – allows you to specify the Docker Image URL instead of the Build Version if you are deploying a pre-built component (e.g., from the xpresso.ai Component Library).
Command - commands that you want the Docker image of the component to run. Use the “+” icon to add more commands, and “-” icon to remove any.
specify any argument values to the commands executed within the Docker image of the component. If you want to specify the argument name, and specify the argument value at run-time, check the “Dynamic” checkbox, and enter the argument name.
Tip
Note that the dynamic argument option is applicable only when a component is included in a pipeline. When a component is deployed on its own, it is run immediately, with the argument values passed to it as part of the command - dynamic arguments are not supported.