Model Ops
The ModelOps section enables you to schedule, compare, run, and start your experiments, view details of experiments and scheduled experiment runs, and manage them. It also allows you to view the repository of trained and deployed models, deploy new models, and run split or A/B tests.
xpresso.ai supports all popular machine learning frameworks and provides special support through pre-built components in the xpresso Component Library for some of these: XGBoost, Sklearn, Keras, and LightGBM.
This section contains information on how you can work with new experiments and view details related to them.
For more information on these topics, see the following:
Viewing Experiments
Viewing Experiments
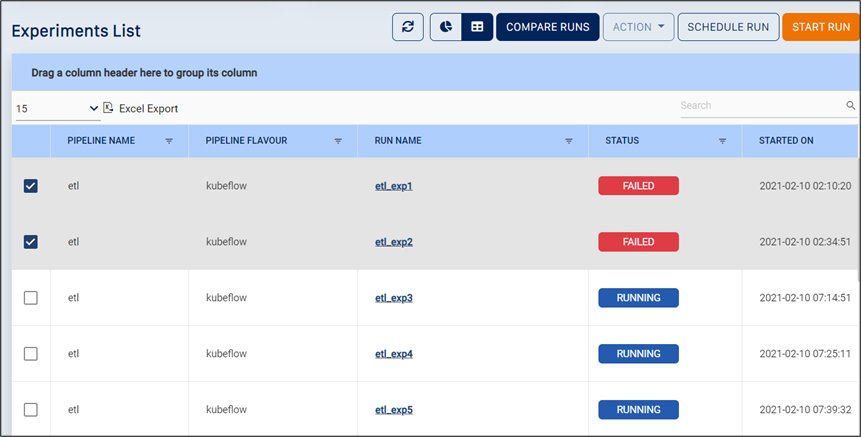
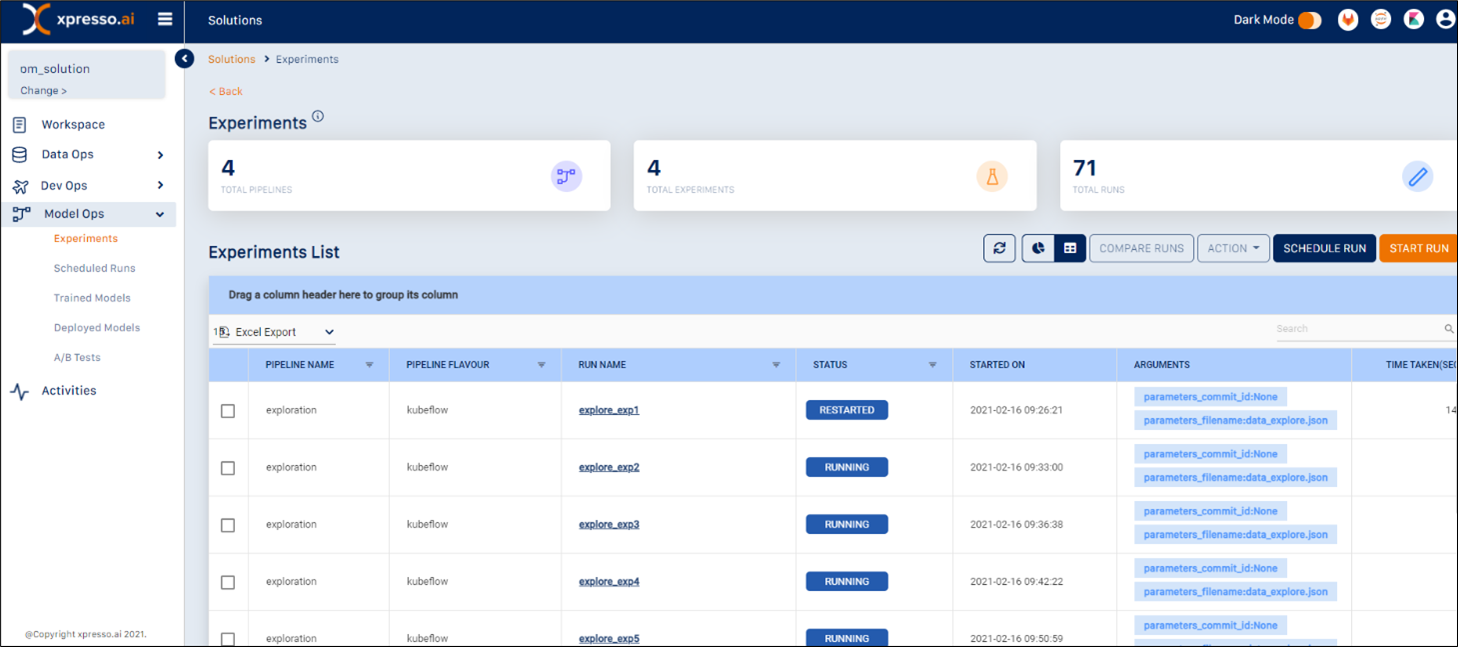
You can view and manage details of experiments on this page. You can also schedule, compare and start experiment runs, and perform additional tasks on this page.
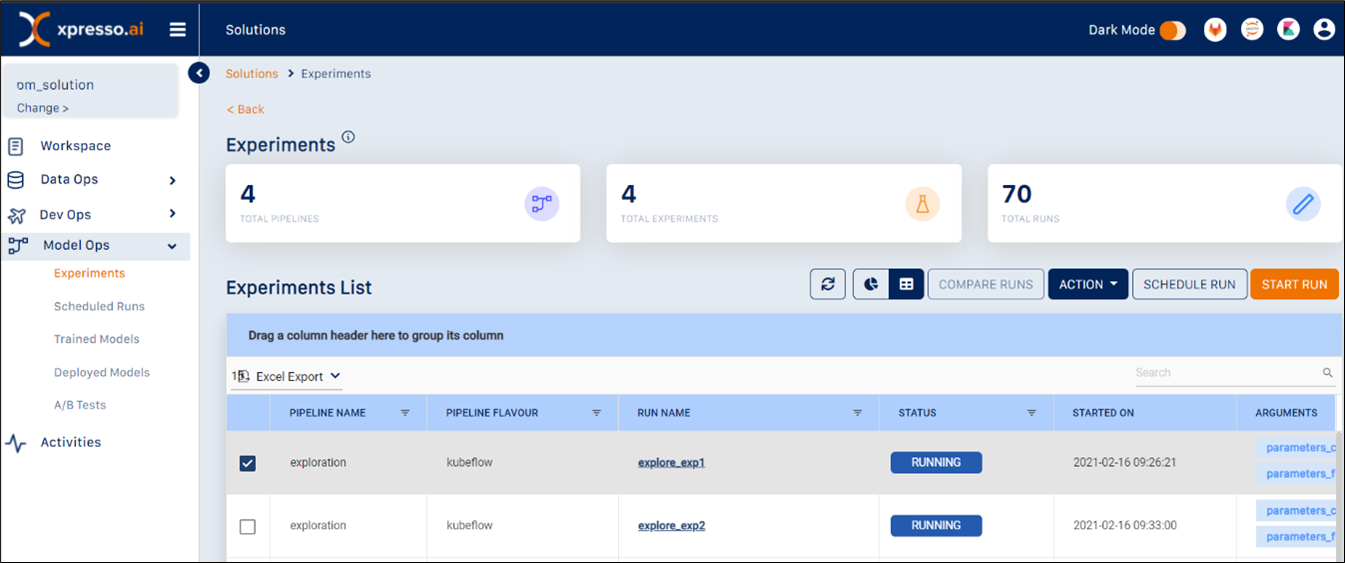
After you log in to the xpresso.ai Control Center, click on any ‘active solution’. On the page that appears, from the left-hand menu, click Model Ops and then click Experiments. A dashboard appears.
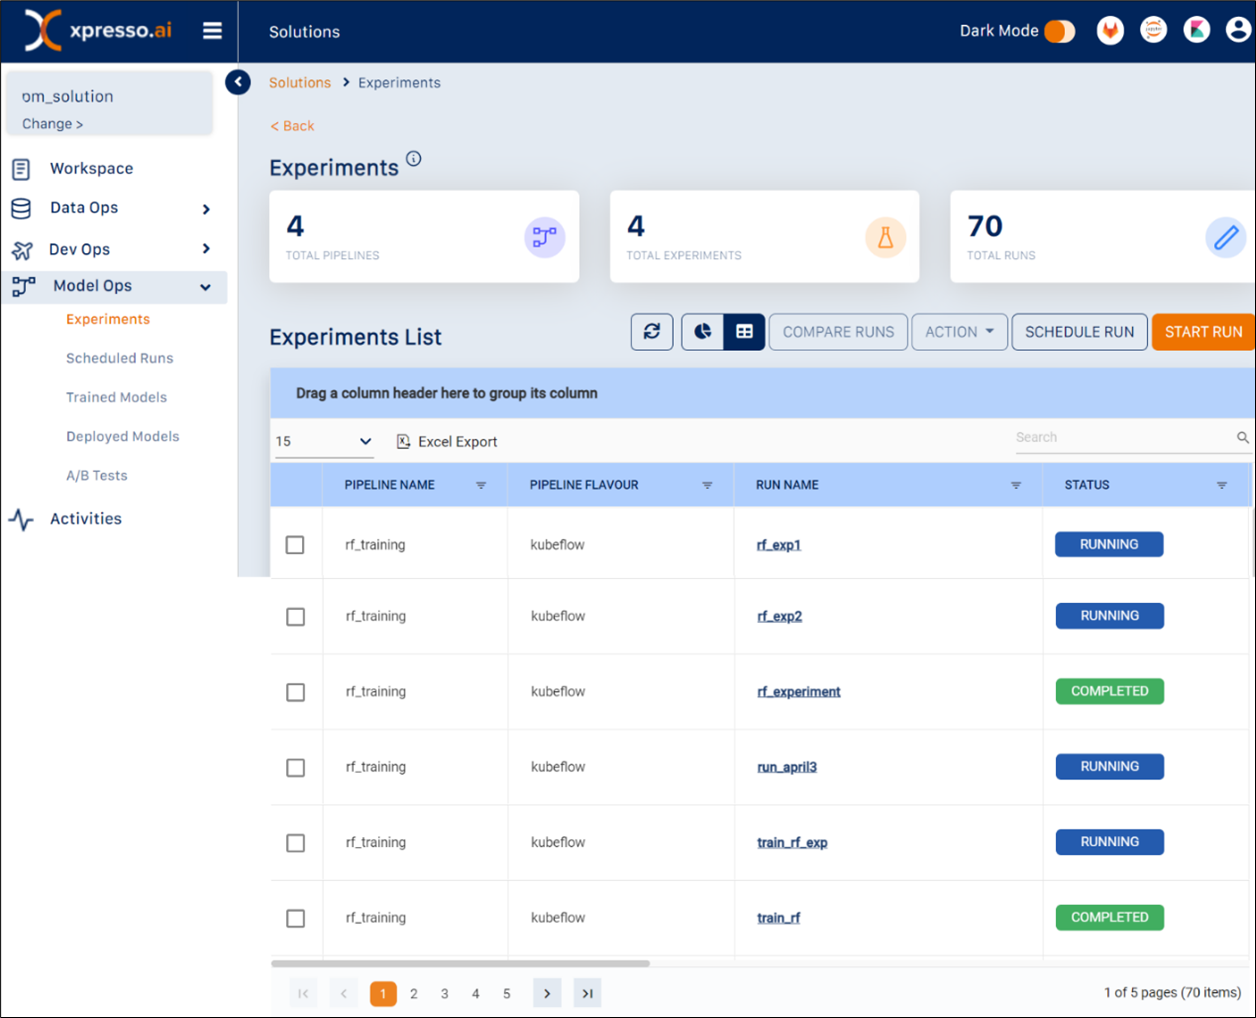
You can view the following details on this page:
Pipeline Name
Pipeline Flavor
Run Name
Status (Running/Completed/Failed)
Started On
Arguments
Time Taken (Seconds)
Started By
Last Updated Date
Commit ID (Output)
Experiment Name
This page provides two options to view details – the “Chart” view and the “Table” view.
Changing View
You can view the details of Builds using either the “Chart View” or a “Table View”. To change the view, on the right corner, click “Chart View” or “Table View”.

Managing Additional Tasks
You can also view results from a specific page, search for specific experiments, and export your data to an Excel file.
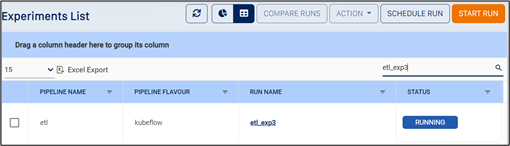
To search for a specific experiment, use the search box to search using any field (see below for an example using a run name for the search)
To choose the number of experiments that you can view on a single page, click the arrow and choose from 5, 10, 15 or 20 entries.

To export your data into an Excel file, click Excel Export.

You can skip to a specific page or move to the first or last page of entries by clicking the page number or the arrows, respectively.

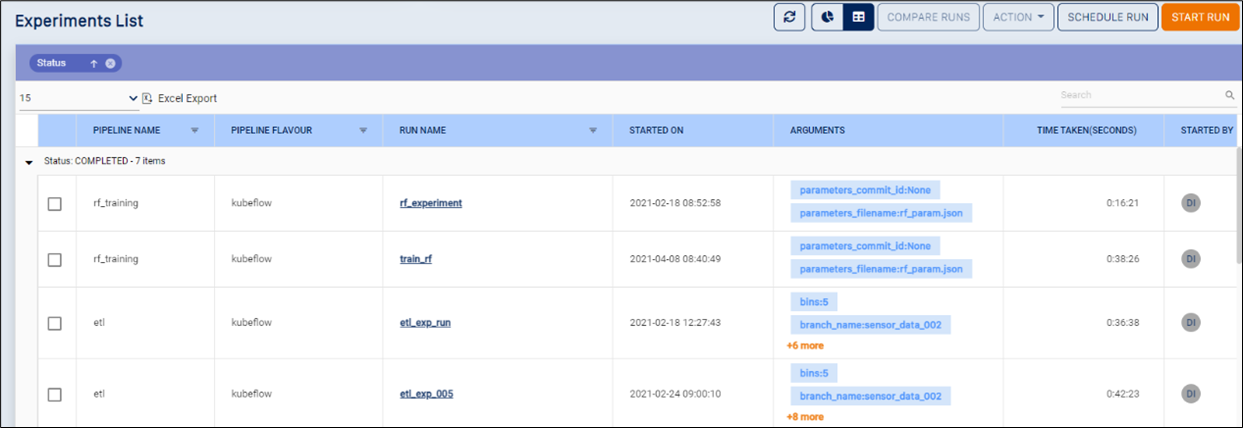
You can drag any column header to the top of the table to group by the column (see below for an example of data grouped by “Status”)
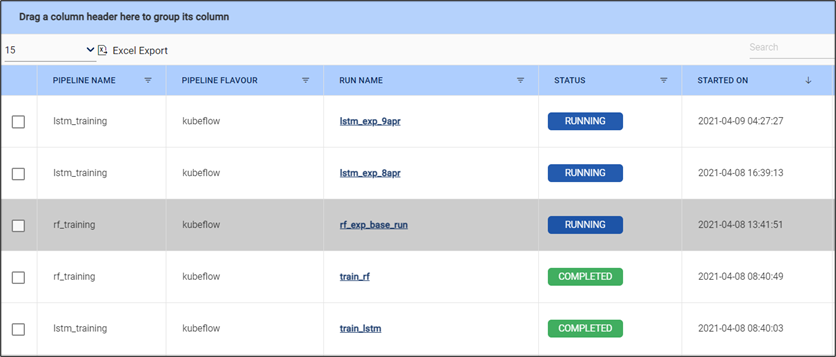
You can click any column name to sort by the column and click again for reverse sort (see below for an example of the list reverse-sorted by date).
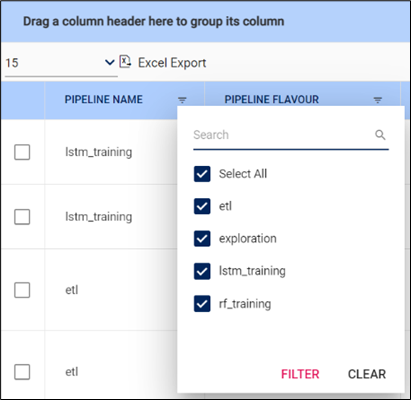
You can also filter some of the columns such as “Pipeline Name”, “Pipeline Flavour”, “Run Name”, “Status”, “Started By”, and “Experiment Name” that support filtering. Click the filter icon next to these columns to filter by the value(s) specified (see below for an example of filtering by “Pipeline Name”)
Starting a Run
To schedule a run, from the Experiments page, click Start Run.
A dialog box containing details for a new run appears.
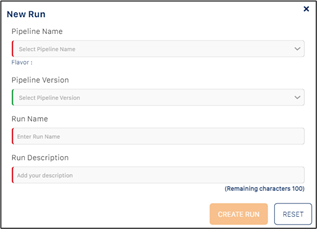
In the dialog box, modify the following:
Pipeline Name
Pipeline Version
Tip
Based on the “Pipeline Name” you have selected, the pipeline version appears.
Run Name
Run Description
Tip
Enter a description that matches the Run Name you’ve provided.
Based on your selection for “Pipeline Name” and “Pipeline Version”, additional parameters appear. Modify these additional parameters, as required.
Tip
You can also include these parameters in a JSON file and store it in the shared space (NFS). You can provide the path to that file in the text box “parameters_filename”.
Modify the details and click Create Run.
Tip
To clear details that you’ve entered, click Reset.
Comparing Runs
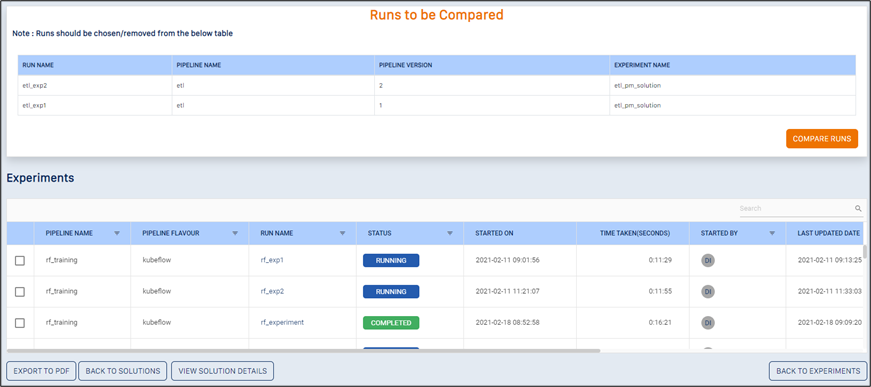
To compare runs, select two or more experiments from the list of experiments and then click Compare Runs.
The Compare Runs dialog box appears.
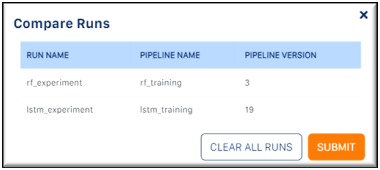
Verify the runs you’ve selected and click Submit. The Compare Runs report appears for the selected runs. (See below for an example of a report for the runs ‘ETL_EXP1‘ and ‘ETL_EXP2’).
Tip
To clear your selections and go to the “Experiments List” page, click Clear All Runs.
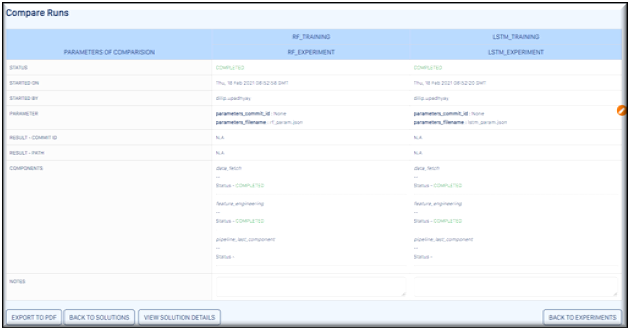
You can perform the following actions on this page:
You can export the data to a PDF file by clicking Export to PDF.
You can go to the “My Solutions” page to view a list of active solutions, and select another solution by clicking Back to Solutions.
You can go to the “Workspace” page to view details entered for this solution, and edit them as required by clicking View Solution Details.
You can go back to the “Experiment Compare Run” page to edit the runs you want to compare by clicking the icon. The list of experiments is displayed along with your selection, which you can modify.
You can go back to the “Experiments List” page by clicking Back to Experiments.
Managing Runs
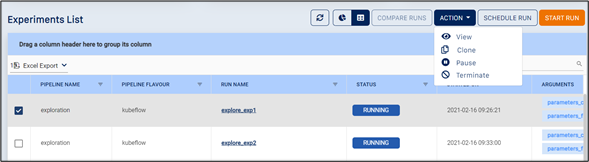
To perform additional actions on a run, from the Experiments page, select a run and then select Action.
From the drop-down that appears, you can select from the following:
View – displays details of a run
Clone – clone a run
Pause – pause a run
Terminate – end a run
Viewing Details of a Run
To view details of a run, click View.
A page displaying details of a run appears. (See below for an example).
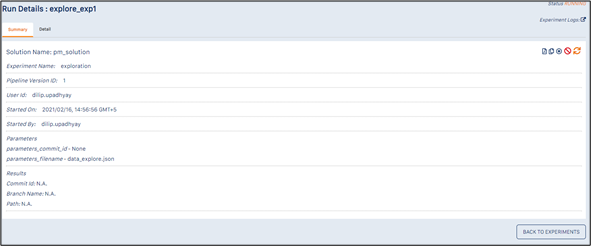
On this page, you can perform the following actions by clicking the icons on the top-left.
Export to PDF – export details to a PDF file
Clone a Run
Pause/Restart a Run
Terminate a Run
Refresh Details
View Experiment Details
To go back to the “Experiments List” page, click Back to Experiments.
To view details of a run, click the “Details” tab to view Metrics, Metrics Data, and Pipelines.
To view the experiment logs, click Experiment Logs. This redirects you to the Kubeflow page where you can now view the logs.
Cloning a Run
To clone a run, click Clone.
A dialog box displaying details of the run you’ve selected appears. (See below for an example).
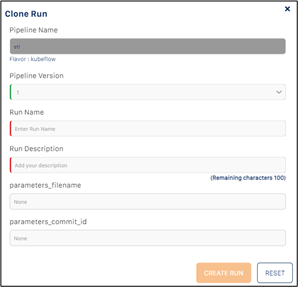
On this page, you can modify the following details:
Pipeline Name
Pipeline Version
Run Name
Run Description (in 100 characters)
Refresh Details
parameters_filename
parameters_commit_id
Click Create Run. A page confirming details of the cloned run appears. (See below for an example).
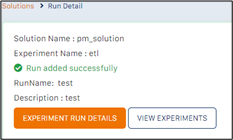
Tip
To clear details, click Reset.
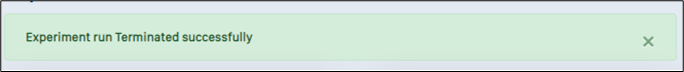
Pausing/Restarting a Run
To pause a run, click Pause. Or Clik on Restart, when in paused state.
A message confirming the paused run appears.

Note
You can restart an experiment, once it is paused. It will resume execution of the pipeline from the last component run. You can also customize the state to be saved before a pause in your code directly.
Scheduling a Run
To schedule a run, from the Experiments page, click Schedule Run.
A dialog box containing details that can be modified before scheduling appears.
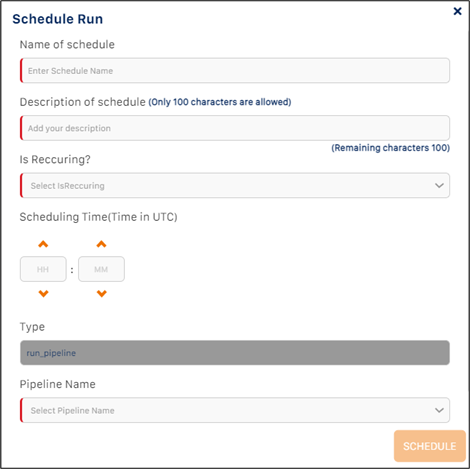
You must specify the following:
Schedule Name - name for the schedule
Schedule Description - description of the schedule
Is Recurring? - Select “True” if you want the schedule to recur, or “False” if you want a one-time schedule
Scheduling Time - select the time (HH:MM) when you want the experiment to be run
Recurring frequency - If you selected “True” for “Is Recurring?”, select the frequency from the available choices (“Daily”, “Weekly”, “Monthly”)
If you selected “Weekly” for the Recurring Frequency, you must specify the day of week when the experiment is to be run every week in the “Recurring Day” field
If you selected “Monthly” for the Recurring Frequency, you must specify the date of the month when the experiment is to be run every month in the “Recurring Date” field
The other fields on this screen should be completed in the same manner as when running an experiment
Click “Submit” to submit the schedule.
Managing Scheduled Runs
You can view, modify and delete a scheduled run, and perform additional tasks on this page.
After you log in to the xpresso.ai Control Center, click on any ‘active solution’. On the page that appears, from the left-hand menu, click Model Ops and then click Scheduled Runs. A dashboard appears.
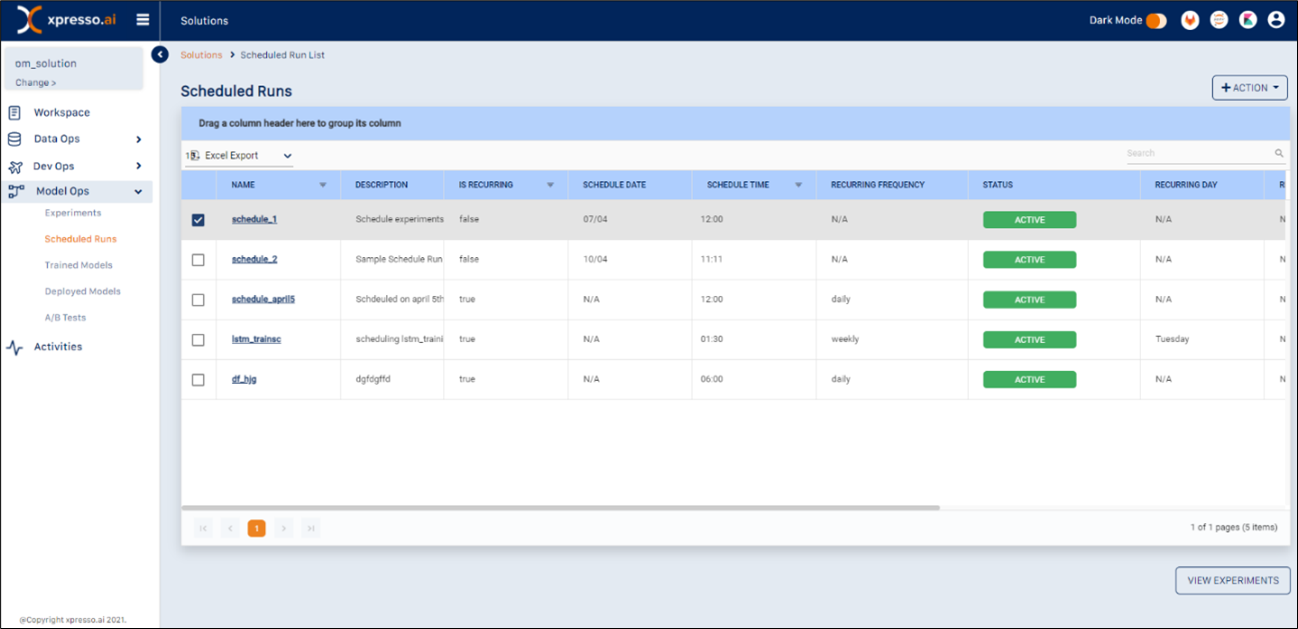
You can view the following details on this page:
Name - name of schedule
Description - description of schedule
Is Recurring - true if the schedule is recurrent, false if not
Schedule Date - date when schedule was created
Schedule Time - time when schedule was created
Recurring Frequency - recurring frequency of schedule
Status - schedule status
Recurring Day - day of week on which experiment is to be run (for weekly recurrence)
Recurring Date - date of month on which experiment is to be run (for monthly recurrence)
Pipeline Name - name of pipeline to be run
Pipeline Version - version of pipeline to be run
After selecting a schedule, from the top-left, click Action.
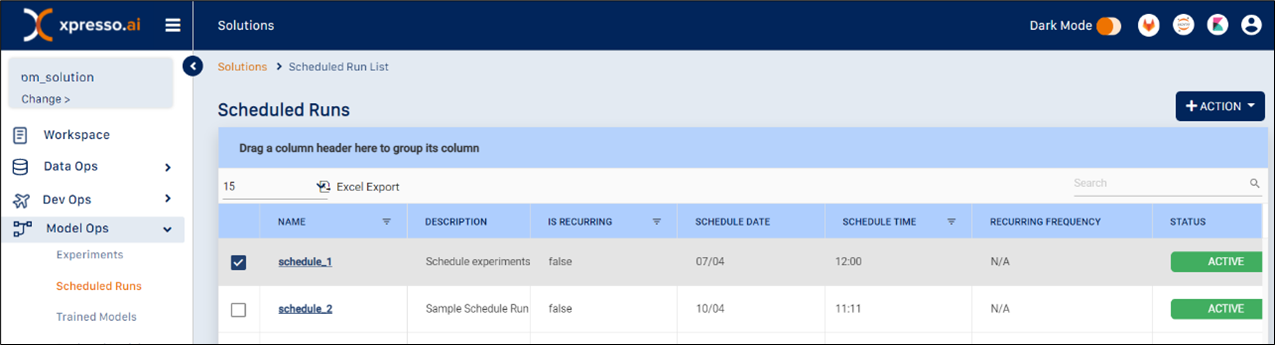
A drop-down appears.
To view details, click View. This displays a page with schedule details.
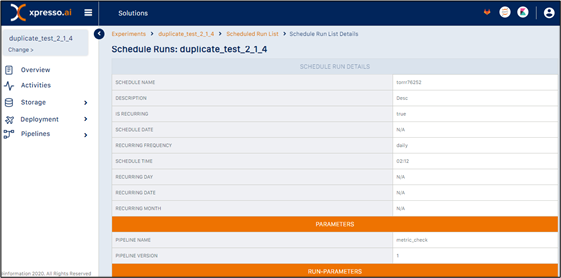
To modify schedule details, click Modify. This will open a dialog with the schedule details.
You can change these in the same way that you created the schedule earlier. For more information, see Scheduling a Run .
To delete the schedule, click Delete. A confirmation dialog appears.

To continue deleting a scheduled run, click OK.
Managing Additional Tasks
You can also view results from a specific page, search for specific scheduled runs, and export your data to an Excel file.
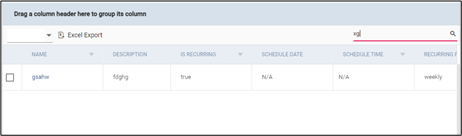
To search for a specific scheduled run, use the search box to search using any field (see below for an example using a run name for the search)
To choose the number of schedules that you can view on a single page, click the arrow and choose from 5, 10, 15 or 20 entries.

To export your data into an Excel file, click Excel Export.

You can skip to a specific page or move to the first or last page of entries by clicking the page number or the arrows, respectively.

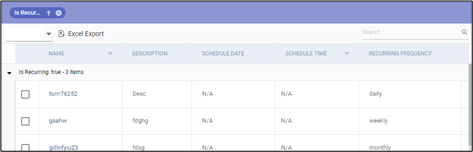
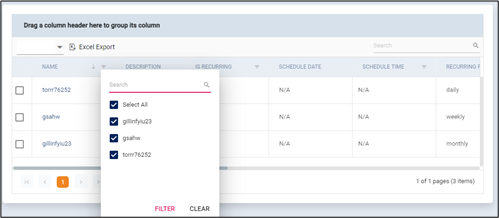
You can drag any column header to the top of the table to group by the column (see below for an example of data grouped by “Is Recurring”)
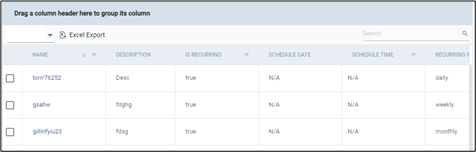
You can click any column name to sort by the column and click again for reverse sort (see below for an example of the list reverse-sorted by schedule name).
You can also filter most of the columns. Click the filter icon next to these columns to filter by the value(s) specified (see below for an example of filtering by “Schedule Name”)
Viewing a list of trained models
xpresso.ai enables developers to maintain versions of models output by pipeline runs. Different versions of models are stored in the model repository. A model repository consists of branches corresponding to experiment runs, with each branch containing commits. Output models are automatically versioned by xpresso.ai when generated as part of training pipelines.
You can view and manage details related to trained models, deploy a new model, and perform additional tasks.
After you log in to the xpresso.ai Control Center, click on any ‘active solution’. On the page that appears, from the left-hand menu, click Model Ops and then click Trained Models. A dashboard appears.
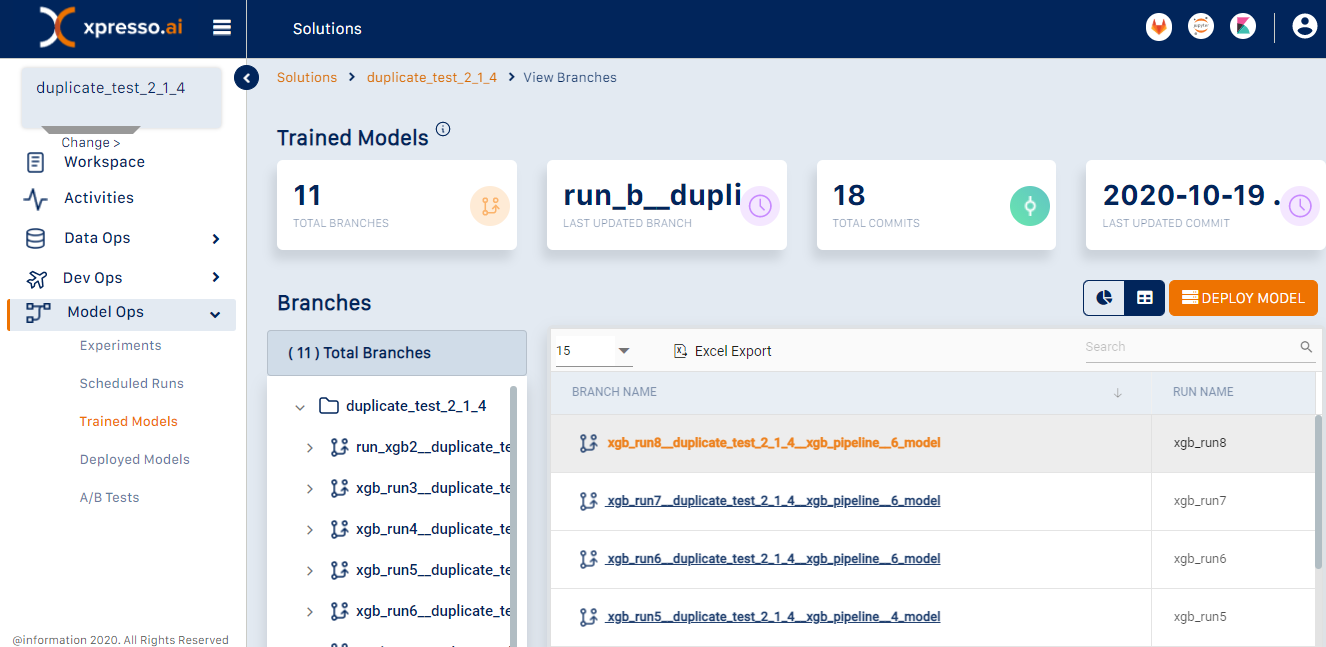
You can view the left-hand panel that initially displays the solution at the root and the different branches (i.e., experiment runs) under it.
You can view the right-hand pane containing details of all branches (i.e., experiment runs) in the solution.
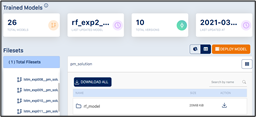
You can also view the following details on this page:
Total Models
Last Updated Model
Total Versions
Last Updated At
This page provides two options to view details – the “Chart” view and the “Table” view.
Changing View
You can view the details of Builds using either the “Chart View” or a “Table View”. To change the view, on the right corner, click “Chart View” or “Table View”.

Managing Additional Tasks
You can also view results from a specific page, search for specific branches/experiment runs, and export your data to an Excel file.
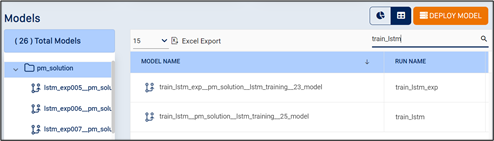
To search for a branch/experiment run, use the search box to search using any field.
To choose the number of branch/experiments runs that you can view on a single page, click the arrow and choose from 5, 10, 15 or 20 entries.

To export your data into an Excel file, click Excel Export.

You can skip to a specific page or move to the first or last page of entries by clicking the page number or the arrows, respectively.

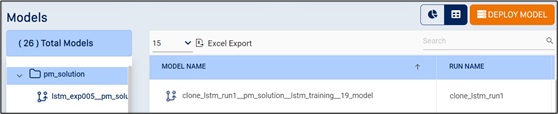
You can click the “Model Name” column to sort the list of model names and click again for reverse sort.
Managing Commit Details
To see the commits under the branch, click the commit expander (“>”) next to a branch.
To see commit details, click the branch name on either pane.
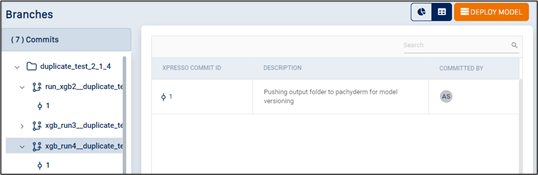
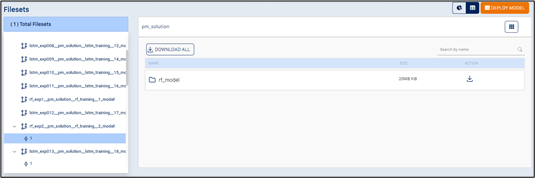
Click the commit ID on either pane to display the model.
A model consists of the entire folder, sub-folders and files which were stored at the end of the experiment run.
Click the folder icon to see the model.
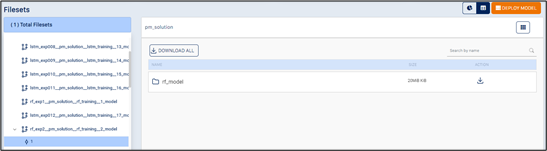
To download a single file/folder, under the column “Action”, click the
 icon.
icon.To download all files in the model, click the Download All icon.
Deploying a Model
Deploying a trained model creates a REST API end point for it. This may be used to send requests to the model and get predictions. You can deploy one or more trained models at a time.
Tip
To deploy a trained model, it has to be wrapped within an Inference Service. An Inference Service is a special form of a web service customized to query a trained model and return a prediction from it. One or more trained models can be deployed at a time and each must be coupled with an Inference Service.
To deploy one or more trained models, on the “Model Repository” page, click Deploy Models.
The “Deploy Model” page appears.
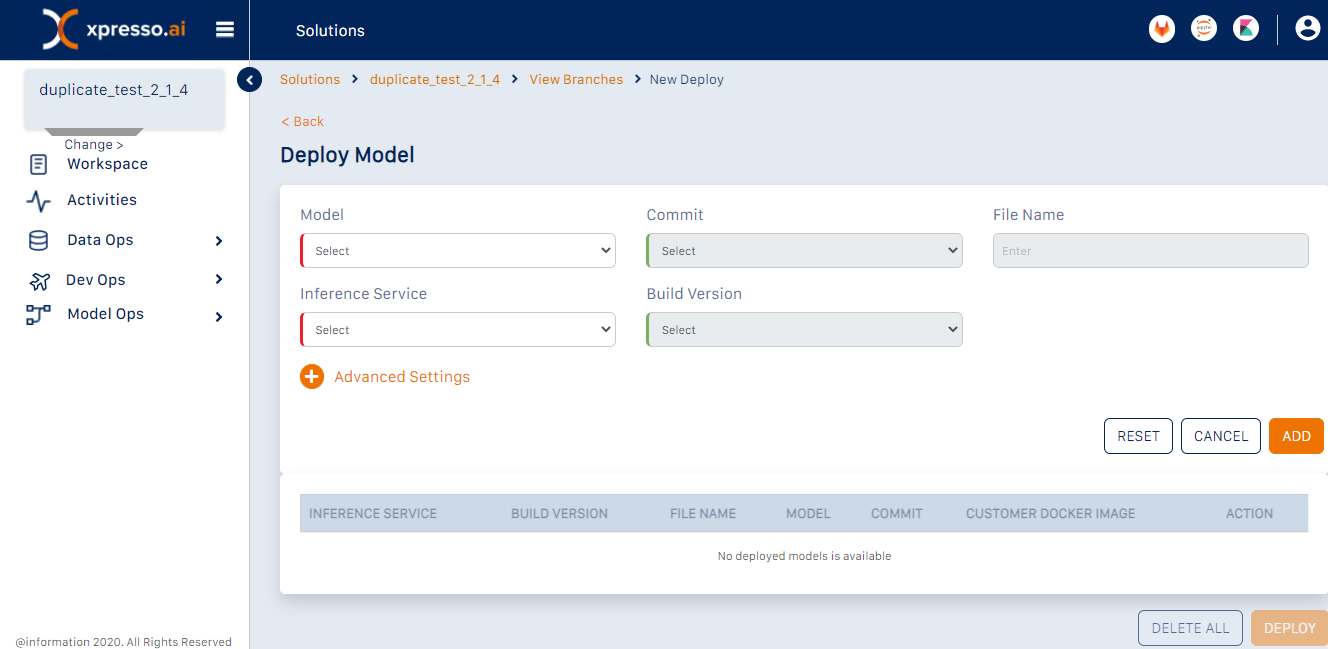
For each model that you want to deploy, you must do the following:
Select the trained model to be deployed.
Tip
Since each trained model is the output of a successful experiment run, you are selecting an experiment run in this step.
Select the Version of the model.
Select the Inference Service to be coupled with the trained model from a list of Inference Services available in the solution.
Tip
Ensure that the selected Inference Service is compatible with the model selected. An Inference Service is created for a particular model. For example, XGBoost Model must have XGBoost inf svc. If you select the XGBoost model, you need to ensure that the corresponding inf svc is selected from the Inference Service drop-down as well.
Select the Build Version of the Inference Service.
Specify any Advanced Settings by expanding the “Advanced Settings” section.
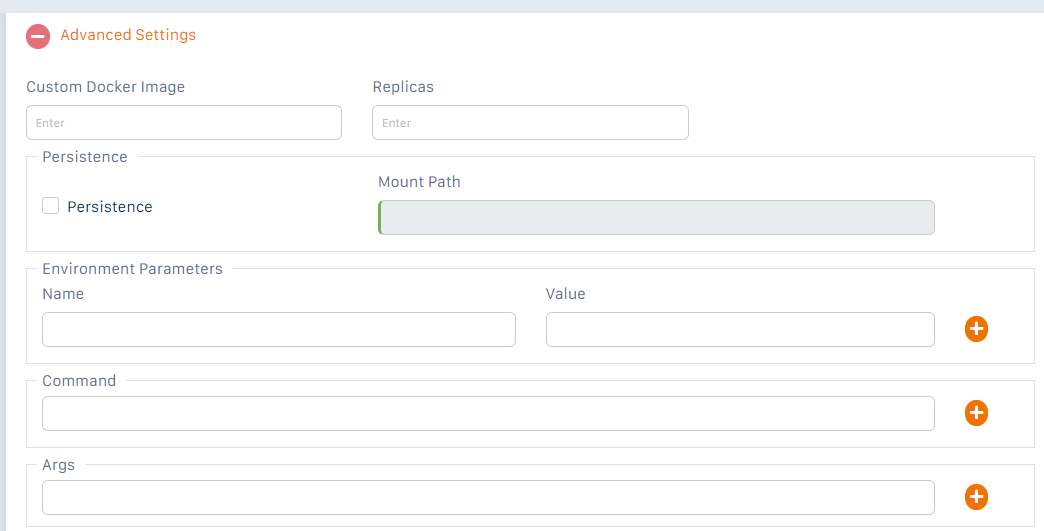
The Advanced settings are the same as those when you deploy a service component.
Click Add. The model selected is added to the list of models to be deployed in the table below.
To add more models to be deployed, repeat the above steps.
To deploy the model(s), click Submit.
Viewing Deployed Models
You can view a list of deployed models, run A/B Tests, and perform additional tasks on this page.
After you log in to the xpresso.ai Control Center, click on any ‘active solution’. On the page that appears, from the left-hand menu, click Model Ops and then click Deployed Models. A dashboard appears.
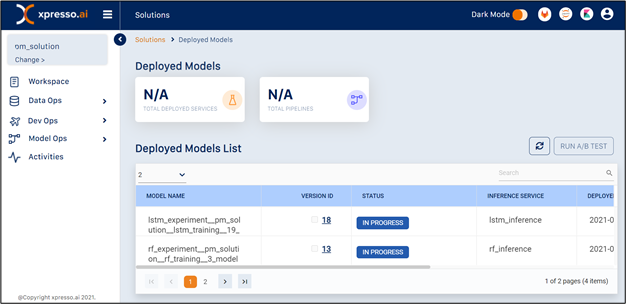
You can view the following details on this page:
Model Name - Name of model (i.e., the experiment run which produced the model)
Version ID - Model commit ID
Status - whether the deployment was successful or not
Inference Service - Name of inference service coupled with the model
Deployed On - Date when the model was deployed
Deployed By - User ID of developer who deployed the model
URL - URL of the basic UI that you can use to test your inference service
IP - URL of the REST API end point of the model
Running A/B Tests
A/B Tests enable data scientists to test multiple deployed models simultaneously, in order to check which one works best.
To run an A/B Test, on the “Deployed Models” page, select two or more successfully deployed models.
From the top-right corner, click Run A/B Test. The “A/B Testing Run” page appears. This page enables you to run an A/B Test on two or more deployed models.
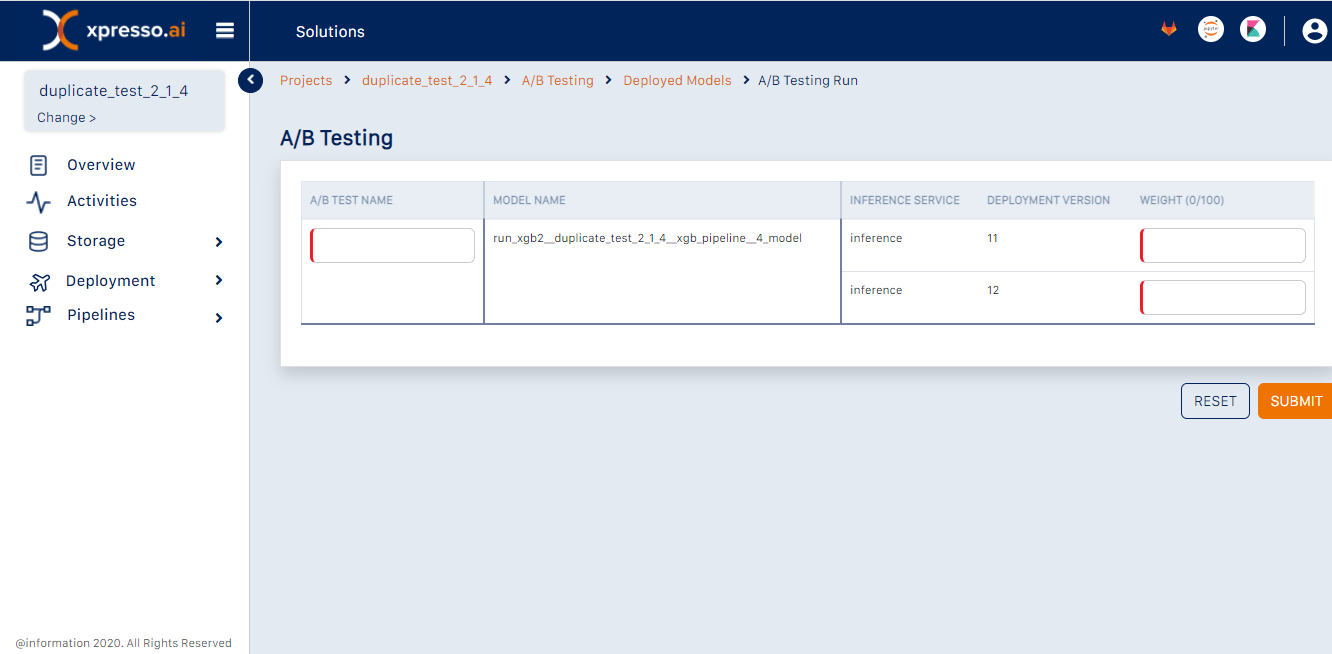
You can enter details for the following fields on this page:
A/B Test Name
Weight – You can specify a routing strategy by entering the weights for each model in the test.
Tip
i. The weight of a model indicates the probability of the model being hit by a request.
ii. Weights must add up to 100. This is automatically done by the UI. For example, if there are two models in your test, and their weights are set to 80 and 20, this means that the first model will be hit approximately 80% of the time, and the second will be hit approximately 20% of the time. In other words, out of every 100 requests, approximately 80 will go to the first model, and approximately 20 to the second.
Managing Additional Tasks
You can also view results from a specific page and search for specific deployed models.
You can skip to a specific page or move to the first or last page of entries by clicking the page number or the arrows, respectively.
Managing A/B Tests
You can view a list of A/B Tests that have been created on a solution, and perform additional tasks on this page.
After you log in to the xpresso.ai Control Center, click on any ‘active solution’. On the page that appears, from the left-hand menu, click Model Ops and then click A/B Tests. A list of A/B Tests appears.
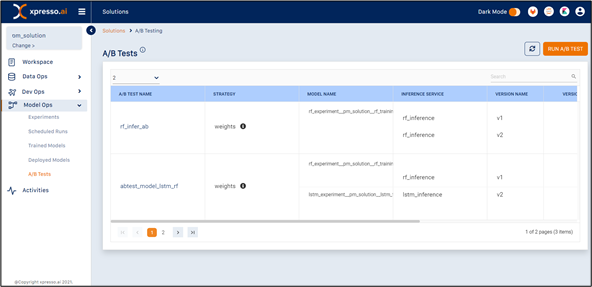
You can view the following details on this page:
A/B Test name - name of the A/B test
Strategy - the routing strategy defined in terms of weight. Click on the information icon to see the details
Model Name - The names of the model that were used for the A/b test
Version Name & ID - Version of each models used
Deployed On - Date when the A/B Test was deployed
Deployed By - User ID of developer who deployed the A/B Test
URL - URL of the basic UI that you can use to test your A/B Test
IP - URL of the REST API end point of the A/B test
You can skip to a specific page or move to the first or last page of entries by clicking the page number or the arrows, respectively.
