Viewing a list of solution experiments
To view a list of experiments that have been run on a solution, click the “Model Ops” link on the left-hand pane, and then click the “Experiments” link. This displays the “Experiments List” page (below)
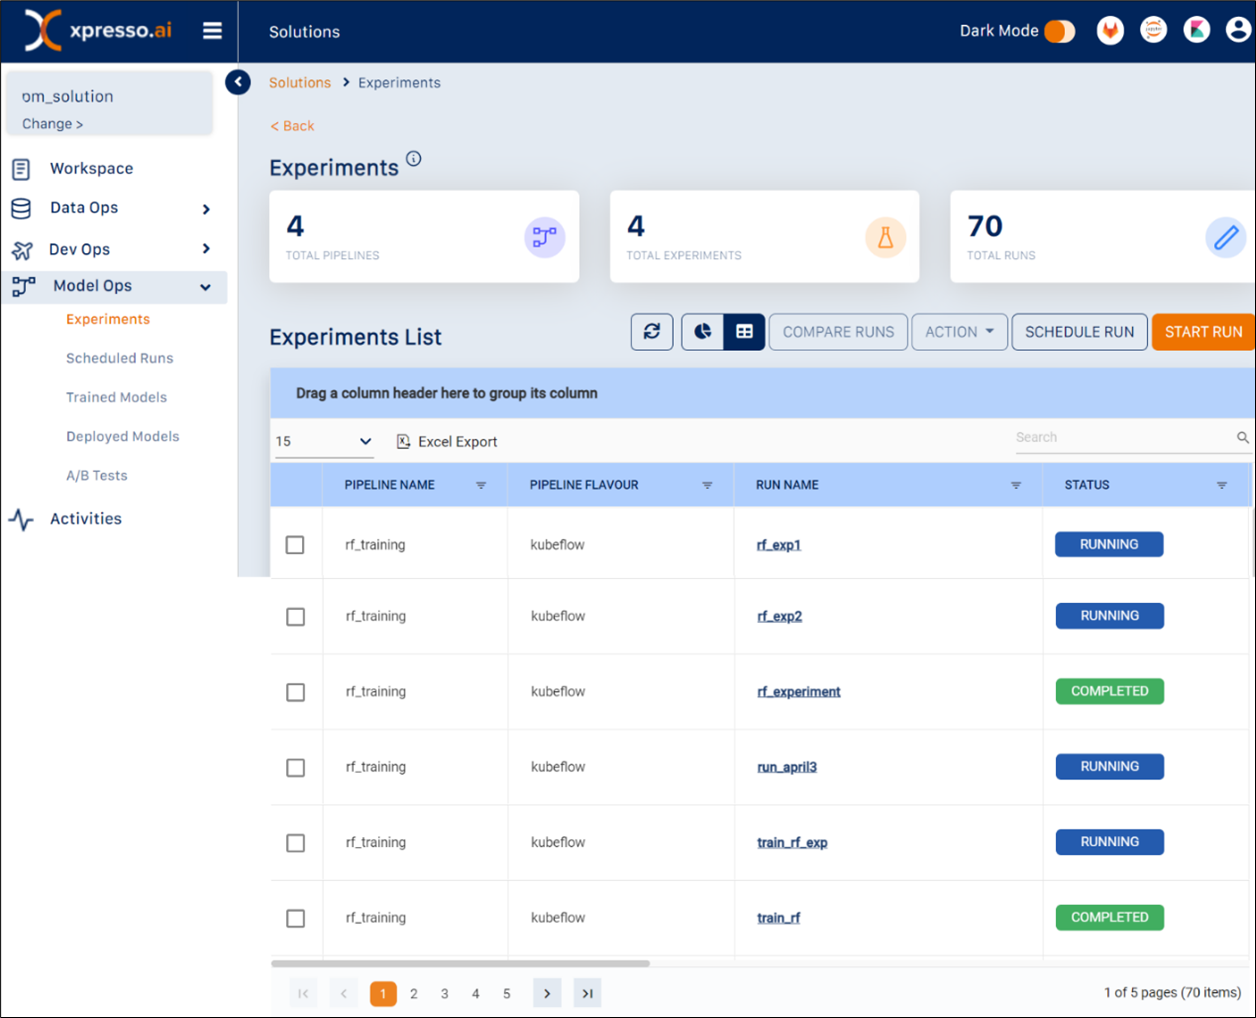
This page displays a table displaying information about each experiment run in the solution. The table contains he following columns:
Pipeline Name - name of pipeline
Pipeline Flavour - indicates whether the pipeline was run on a distributed (Spark) environment, or a non-distributed (Kubeflow) environment
Run name - name of run (input by user at the time of starting the run)
Status - status of run (can be “Running”, “Completed”, “Paused”, “Terminated”)
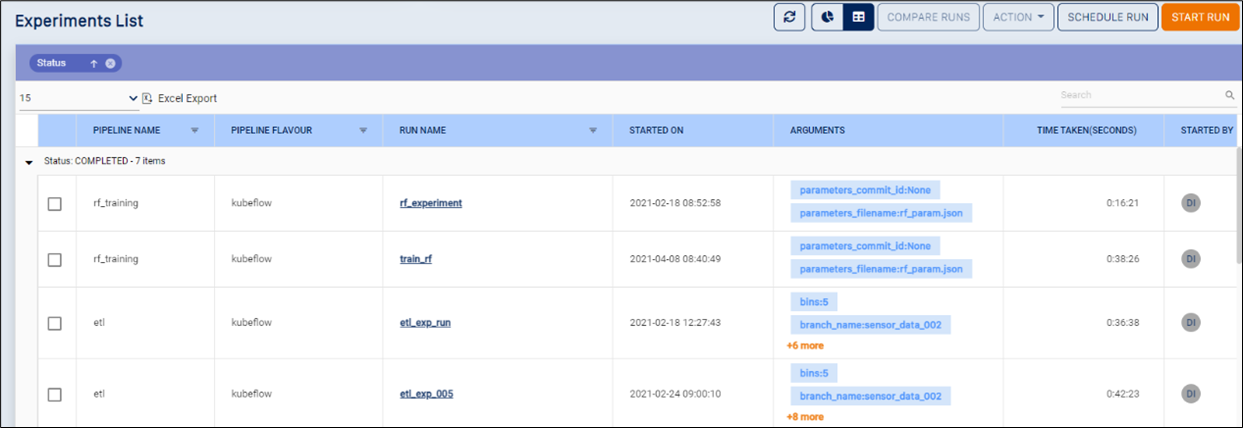
Started On - time the run was started
Arguments - parameters provided for the run
Time Taken - time taken by run (in seconds)
Started By - name of user who started the run
Last Updated Date - date the run was last updated
Commit ID (Output) - displays the commit ID of any output (if the pipeline run produces an output, xpresso.ai automatically stores this in the model repository, and generates a commit ID)
Experiment name - name of experiment run on the pipeline (system-generated)
You can perform the following actions on the table:
Grouping - drag any column header to the top of the table to group by the column (see below for an example of data grouped by “Pipeline Name”)
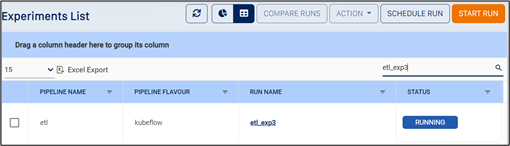
Searching - use the search box to search for a component using any field (see below for an example using “spark” for the search)
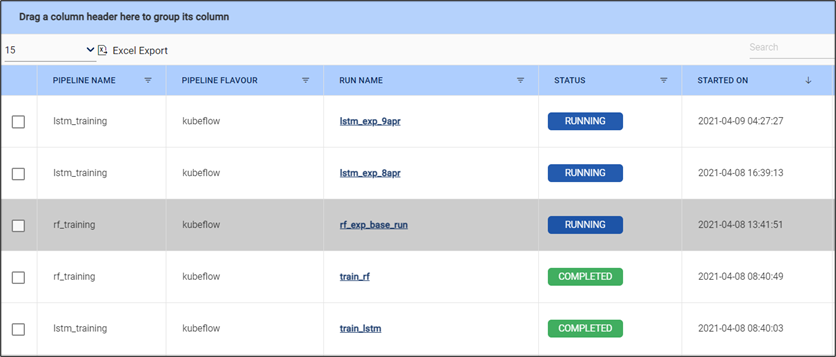
Sorting - Click any column name to sort by the column. Click again for reverse sort (see below for an example of the list reverse-sorted by run name)
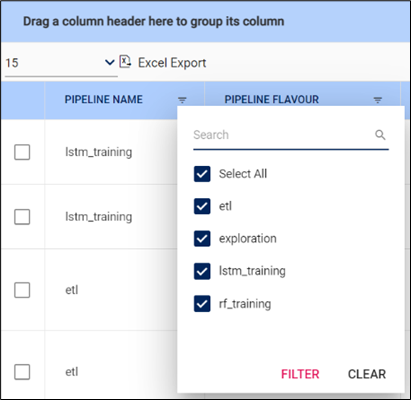
Filtering - most of the columns support filtering. Click the filter icon next to these columns to filter by the value(s) specified (see below for an example of filtering by Pipeline Name)
The toolbar on the top-right of the page (below) enables various other actions.

You can perform the following actions using the toolbar
Refresh the page - click the refresh icon to refresh the page
Toggle between views - Click the View icons to toggle between the tabular and dashboard views of this page
Compare 2 or more runs - select at least 2 runs, and click the Compare Button to compare them
Pause a run - select a run, and then select “Pause” from the “Action” drop-down - this will pause the experiment temporarily. You can restart it using the “Restart” option. The “Pause” option is available only if the experiment is currently running.
Restart a run - select a paused run, and then select “Restart” from the “Action” drop-down - this will restart the run. The “Restart” option is available only if the experiment is currently paused.
Terminate a run - select a run, and then select “Terminate” from the “Action” drop-down - this will terminate the run. The “Terminate” option is available only if the experiment is currently running or paused.
View a run - select a run and click the “View” action from the “Actions” drop-down, or click the name of the run on the table to view the run details
Clone a run - select a run, and then select “Clone” from the “Action” drop-down - This will create a run which is a copy of the one you selected. The process for cloning an experiment is exactly the same as for starting a new experiment, except that all details for the new run are pre-filled (except the name)
Start a new run - click the “Start Run” button to start a new run immediately
Schedule a new run - click the “Schedule Run” button to schedule a new run in the future
What do you want to do next?