Viewing details of an experiment run
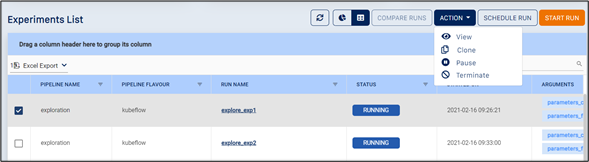
You can view details of an experiment run by clicking the run name on the “Experiments List” page or by selecting it and clicking the “View” action on the “Action” drop-down (see below)
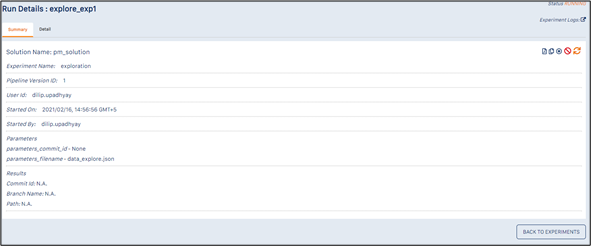
This page has two tabs, one for the Run Summary, and the other for the Run Details.
The “Run Summary” tab contains the following information about the experiment:
Solution Name - name of the solution
Experiment Name - name of the pipeline
Pipeline Version ID - version ID of the pipeline used for the experiment
User ID - ID of user who started the run
Started On - date and time when run was started
Started By - ID of user who started run
Parameters - list of parameters and values used for run
Results - Commit ID and path of the saved model
This tab also has a set of icons on the top right (see below)

These icons are meant for (left to right)
Exporting the experiment details to PDF - this is useful for documentation purposes, or for sharing details with other team members / clients
Cloning the experiment - this is useful for running the same experiment again - the “Run Experiment” dialog is displayed, with the same parameter values filled in - you can just change the parameter values you want to, and run the experiment again
Restarting a paused experiment (available only if the experiment is currently paused)
Pausing a running experiment (available only if the experiment is currently running)
Terminating a running or paused experiment(available only if the experiment is currently paused or running)
The “Detail” tab is shown below.
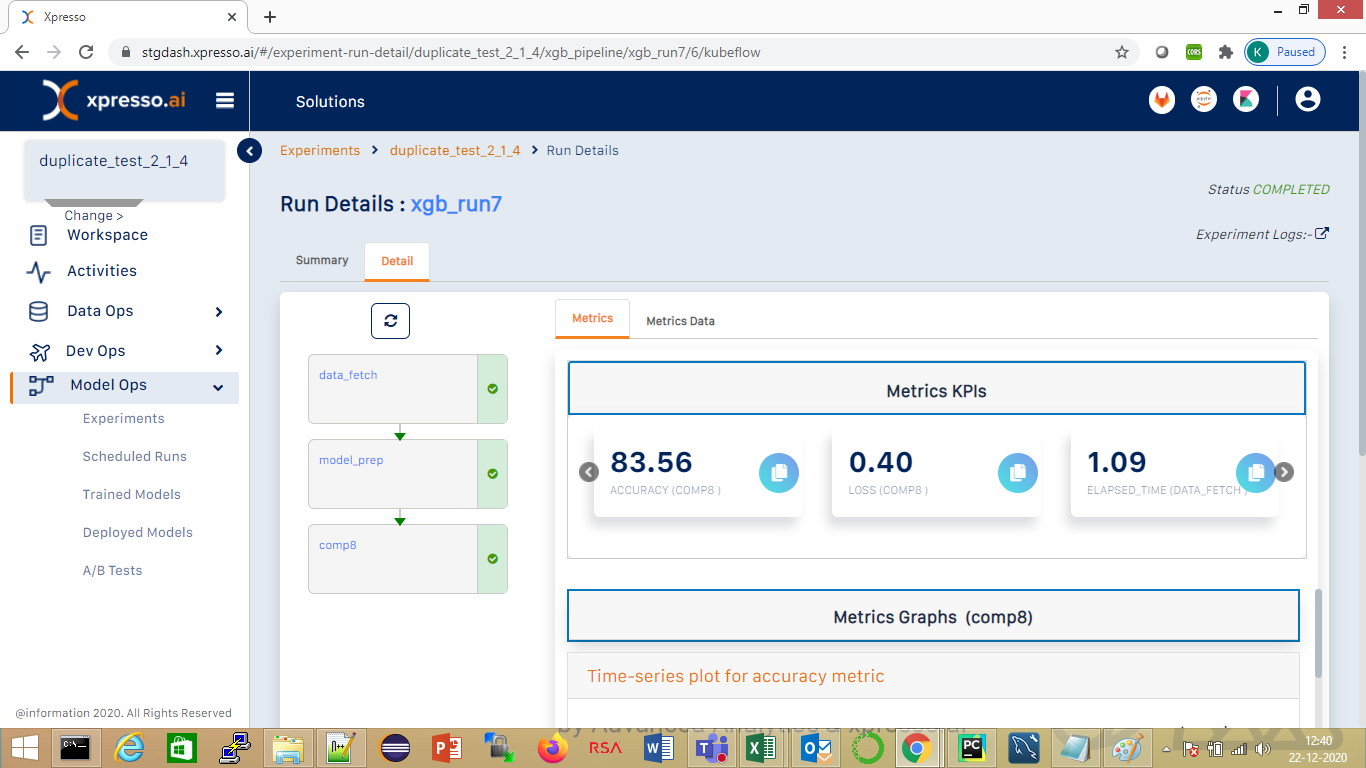
This tab displays each of the components in the pipeline as icons on the left. A component is green if it has completed processing, blue if it is currently in progress, and orange if it has not yet started.
It has 2 sub-tabs:
Metrics (shown above) - this tab displays various KPIs and graphs related to the experiment run, which have been reported back by the pipeline during the run
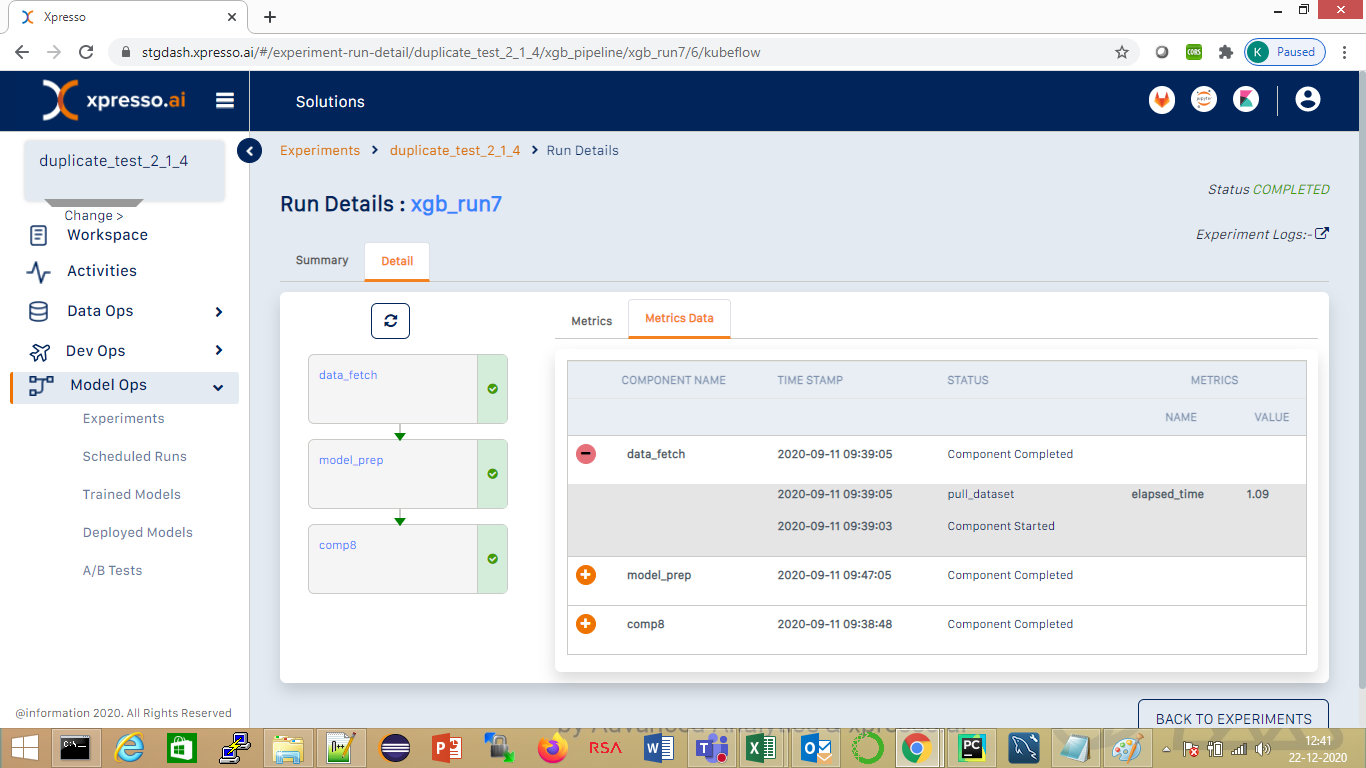
Metrics Data (shown below) - this tab displays the metrics sent by individual components in textual format. You can expand each component to see the metrics in detail
What do you want to do next?